Download
1 / 21
210 likes | 408 Vues
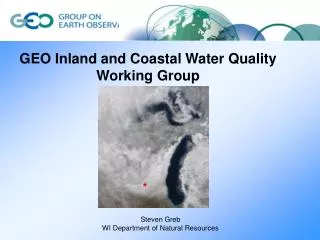
Real-Time Mapping of Coastal and Estuarine Water Quality. Mark Trice Bruce Michael Maryland Department of Natural Resources Paul Barter Cawthron Institute, NZ Walter Boynton University of Maryland, Chesapeake Biological Laboratory. mtrice@dnr.state.md.us www.eyesonthebay.net.

E N D
Real-Time Mapping of Coastal and Estuarine Water Quality Mark Trice Bruce Michael Maryland Department of Natural Resources Paul Barter Cawthron Institute, NZ Walter Boynton University of Maryland, Chesapeake Biological Laboratory mtrice@dnr.state.md.us www.eyesonthebay.net
DATAVIEW Interface 1. Visual Basic Script for ArcGIS 2. Uses ArcGIS GPS Extension 3. Uses NETCOMM serial driver 4. Script Modified from Initial Application by Cawthron Institute. 5. Full Functionality of ArcGIS
Benefits of the Base DATAVIEW Interface 1. Follow previous or set cruise tracks 2. Navigate to existing GIS layers – Bathymetry, habitat, etc. 3. Groundtruthing 4. View map-based data in real-time. 5. Ease of operation within a regular monitoring context. 6. Adaptive Sampling and Better Delineation of Events
Multiple Viewing Options 1. Map 2. Text 3. Chart
Water Quality Mapping 8/14/2005 8/15/2005 8/17/2005 8/18/2005 Area of DATAFLOW Collection Water Quality Mapping 8/18/2005 Case Study – Fish Kill
Future Directions 1. Further field testing within DNR 2. Incorporate existing QA/QC macro 3. Distribution to Chesapeake Bay partners 4. Interactive Tutorial Development 5. Distribute to wider community
Turbidity (25m2 pixel) Chlorophyll (25m2 pixel) Salinity (25m2 pixel) Regional Specific Equation Layer of Light Attentuation (Kd)
Only about 1-2% of Spatial Area is Passing the deeper 1-2 meter PLL/Light Attenuation criteria April 2004 May 2004 June 2004 July 2004 Aug 2004 Sept. 2004 Oct. 2004 Passes at 2.1 PLL Passes at 1.0 PLL Fails 2.1 PLL
Maryland DNR’s Eyes on the Bay Website http://www.eyesonthebay.net
16 Surveys each month April – October 2007 Tidal Fresh Upper Oligohaline Lower Oligohaline Dahlgren Wicomico R St. Clement’s Bay Breton Bay Nomini Machodoc Creek Piney Point St. Mary’s River Rosier Creek Mattox Creek Nomini Creek Lower Machodoc R. Yeocomico River Coan River Lower Potomac
This project was funded by a grant from NOAA/UNH Cooperative Institute for Coastal and Estuarine Environmental Technology, NOAA Grant Number NA03NOS4190195 mtrice@dnr.state.md.us www.eyesonthebay.net