Download

1 / 9
0 likes | 2 Vues
Master Power BI from the ground up with this powerful guide featuring must-know data visualization tricks for beginners and advanced users alike. Learn how to create impactful interactive dashboards, optimize data models, and utilize DAX functions to deliver compelling business insights. This PPT is ideal for students, data analysts, and professionals looking to enhance their Power BI skills and grow in the data analytics field. Stay ahead with expert-recommended techniques and practical examples that align with real-world projects.

E N D
From Basics to Pro: Power BI Data Visualization Mastery Transforming raw data into powerful insights. This is a journey from beginner to advanced visualization expert. Unlock the full potential of business intelligence. pb
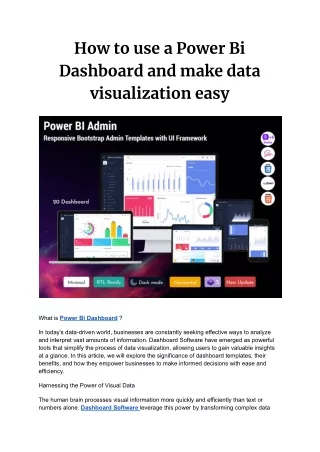
Understanding Power BI Fundamentals Cloud-Based Analytics Data Transformation Power BI is a cloud-based analytics platform. It turns data into actionable insights. Core capabilities include connecting to data. Then, transforming and visualizing the information. • Desktop for report creation • 300M+ monthly active users • Service for online sharing • Global use • Mobile for on-the-go access • Growing fast
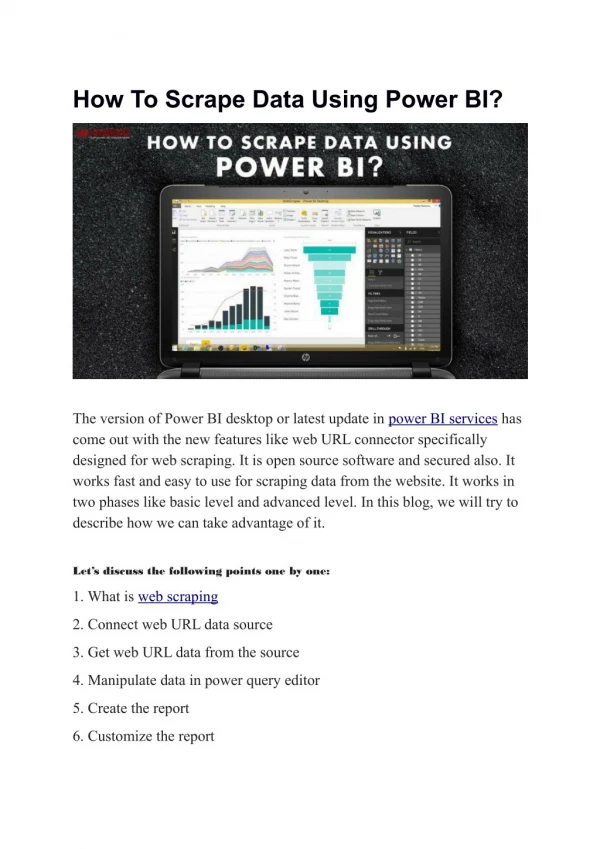
Data Connection and Preparation Multiple Sources Integrate data from various sources. ETL Processes Extract, transform, and load data efficiently. Data Modeling Use techniques for effective relationships. Optimization Improve performance for speed.
Essential Visualization Types Bar Charts Line Graphs 1 Compare categories. Show trends. 2 4 Choosing wisely Pie Charts 3 Know when to use each. Display proportions.
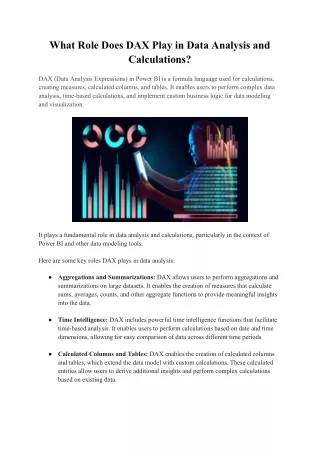
Advanced Visualization Techniques Custom Visuals Add unique charts. DAX Calculations Perform complex analysis. Interactive Dashboards Create engaging experiences. Storytelling Present compelling data narratives.
Performance Optimization Query Tuning 1 Improve speed. Data Refresh 2 Update effectively. Memory Usage 3 Reduce footprint.
Collaboration and Sharing Power BI Service Secure Sharing Enterprise Deployment Mobile Reporting
Future of Power BI and Data Visualization AI Integration 1 Smarter insights. Real-Time 2 Instant analytics. Career Growth 3 High demand skills.
THANK YOU Thank you for joining us today. We hope you found this presentation valuable. We wish you all the best. For more information, or visit our website:- Attitude Academy