Download
1 / 17
170 likes | 281 Vues
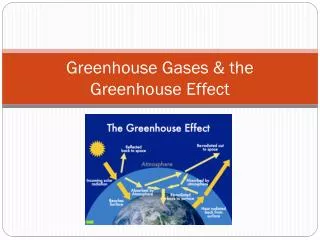
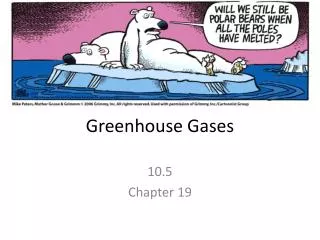
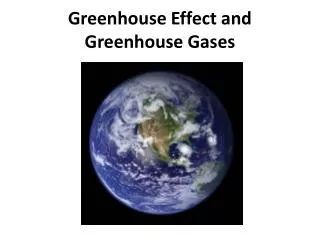
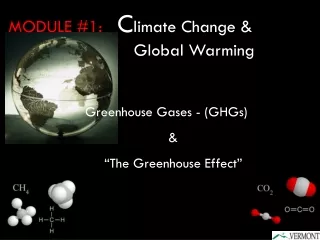
Methodic of measurement the greenhouse gases. Gnedykh V. , and work team of experiments: RUSALKA and ORAKUL. Main species. - water vapor, strong time variation - CO2 contents from 280 to 370 ( ppm )

E N D
Methodic of measurement the greenhouse gases Gnedykh V.,and work team of experiments: RUSALKA and ORAKUL
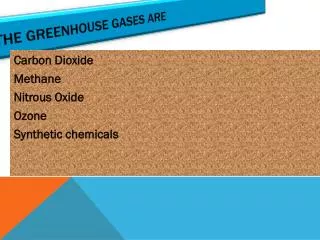
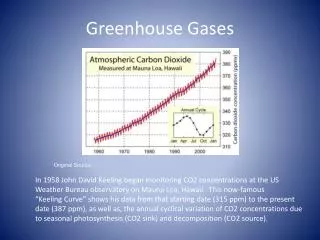
Main species • - water vapor, strong time variation • - CO2 contents from 280 to 370 (ppm) 40 years measurements show - half anthropogenic CO2 rest in atmosphere rest absorbed by ocean and continental ecosystems. • - CH4. It is estimates that emission CH4 in atmosphere is 500 мtper year now.
Differential absorption method These technique requires knowledge of reference spectrum and the absorption spectra of atmospheric species. For the case of direct solar spectra measurements the reference spectrum is extraterrestrial spectrum. The measurement with small spectra resolution not permit get high precision for contents the CO2. (Dufour and Breon, 2000).
Sketch of measurement We select next bands for measurements : CO2 - 1.58 mkm, CH4 - 1.64 mkm. - solar occultation method (satellite) - space measurement solar light reflected by the surface (ISS) - direct solar measurement from
For clear atmosphere The law : I0– extraterrestrial flux l– path the solar light in atmosphere – optical thickness
Initial data • - solar spectra with resolution high than NIR HRS resolution, • - line position and strength for selected spectra bands , • - time of measurement, • - coordinate the searching point, • - coordinate ISS, • - sun angels • - pressure and temperature in searching points .
Absorption lines of molecular oxygenO2at 0.76 µm band, recorded during ground- based solar observations (Tarusa town, Industrial division of IKI, 11:39, 24.06.2005)
The causes of error 1. High-altitude distribution: • humidity • clouds • aerosol ( dimension) • temperature. 2. In searching points : • - coefficient reflection or scattering the surface
Referent channel The O2 A-band is used for assessing path length distribution because it offers important practical advantages: the vertical profile of O2 is well known; no other known absorbers interfere with the O2 A-band absorption and the O2 A-band provides a number of absorption lines covering a suitable dynamic range of opacities in the atmosphere. (Q.-L. Min, 2004) The 1.27 mkm. band is more preferable but emission in band effect on data accuracy.
Ground measurements • Pressure, temperature and humidity in searching points, • sun angels, • long time measurements, • simultaneous with satellite measurements, • compare with different instruments data.
Literature • Dufour E., F.-M. Breon, 2000. Spaceborne estimate of atmospheric CO2 column by use of the differential absorption method: error analysis. Appl. Opt. 42, 3595-3609. • Q.-L. Min, L. C. Harrison, P. Kiedron, and J. Berndt. A high-resolution oxygen A-band and water vapor band spectrometer J.G.R. Vol.109, 2004