Ocean Circulation Dynamics: Wind-Driven Forces and Transport Analysis
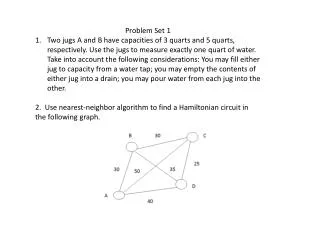
Explore wind-driven circulation in the N. Atlantic using values from NCEP climatology. Estimate Ekman and Sverdrup transports, analyze Gulf Stream data, calculate geostrophic velocities, and derive conservation statement for potential vorticity. Optional for PO students.

Ocean Circulation Dynamics: Wind-Driven Forces and Transport Analysis
E N D
Presentation Transcript
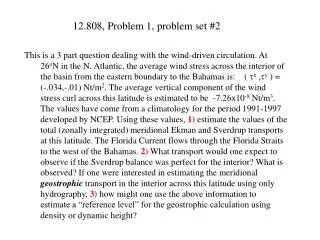
12.808, Problem 1, problem set #2 This is a 3 part question dealing with the wind-driven circulation. At 26oN in the N. Atlantic, the average wind stress across the interior of the basin from the eastern boundary to the Bahamas is: ( tx ,ty) = (-.034,-.01) Nt/m2. The average vertical component of the wind stress curl across this latitude is estimated to be -7.26x10⁻⁸ Nt/m3. The values have come from a climatology for the period 1991-1997 developed by NCEP. Using these values, 1) estimate the values of the total (zonally integrated) meridional Ekman and Sverdrup transports at this latitude. The Florida Current flows through the Florida Straits to the west of the Bahamas. 2) What transport would one expect to observe if the Sverdrup balance was perfect for the interior? What is observed? If one were interested in estimating the meridional geostrophic transport in the interior across this latitude using only hydrography, 3) how might one use the above information to estimate a “reference level” for the geostrophic calculation using density or dynamic height?
12.808, Problem 2, problem set #2 • In this problem you are asked to use MATLAB to analyze real data from the Gulf Stream. Six CTD stations were collected crossing the Gulf Stream 2003 [& so TJ missed some 12.808 lectures]. In addition, a lowered ADCP (LADCP) measured horizontal currents at each station. These files can be found in the directory for Problem set #2. You are asked to: • Plot the temperature/salinity data from the 6 stations in a T/S diagram & briefly discuss where there are large differences among the stations (see right for example of a T/S diagram for sta. 67) • Calculate the geostrophic velocity for the water column for each station pair assuming a level of no motion at 2000 dbar.
12.808, Problem 2 (cont.), problem set #2 3. Consider how to use the LADCP measurements to adjust the assumed level of no motion at 2000 dbar (e.g. one could take the mean of each station pair and use it to shift the geostrophic velocity at 2000 dbar). This was done at the right yet the two don’t agree everywhere.. 4. Extra Credit! Use the result from 3) to estimate the total geostrophic volume transport in the upper 4000m for the 6 stations. This problem requires some familiarity with MATLAB. Please read the README file for problem set #2 for guidance. Remember, that to compare geostrophic with measured velocities, one has to look at velocity normal to the line between each station pair! [Hint: use “sw_dist.m” to get bearing between station pairs.]
12.808, Problem 3, problem set #2 This problem is for PO students: it is optional for others. Using the barotropic momentum and continuity equations for a variable depth ocean of constant density presented in the class notes, derive the conservation statement (below) for potential vorticity in the presences of body forces and friction for a spatially variable Coriolis parameter. Recall that this was stated as a result in class: you are now asked to show how this equation can be obtained. Recall that D=H+h, where z = -H is the depth of the undisturbed fluid and z = h is the free surface.