Download
1 / 16
160 likes | 281 Vues
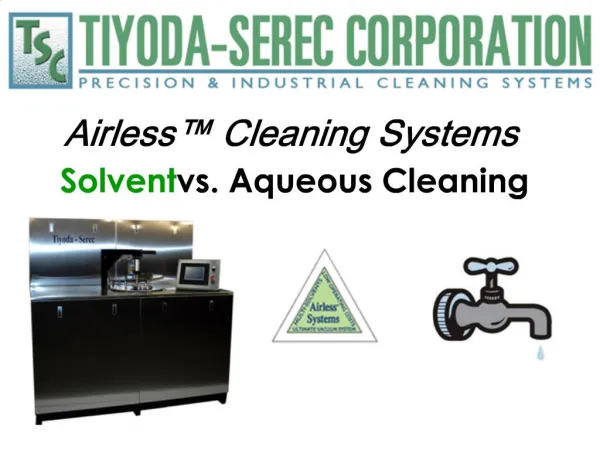
Elimination of Chlorinated Solvent Use in Cleaning: Barriers to Success. Regional Environmental Summit Providence, RI September 28, 2005 Presented by: Massachusetts OTA (Grant funded by EPA Region I). Grant Objectives - Background.

E N D
Elimination of Chlorinated Solvent Use in Cleaning: Barriers to Success Regional Environmental Summit Providence, RI September 28, 2005 Presented by: Massachusetts OTA (Grant funded by EPA Region I)
Grant Objectives - Background • Identify current users of TCE – primarily in vapor degreasing cleaning operations • Perform outreach and provide technical assistance • Finding alternative cleaning chemistry • Compliance with MACT standard • Sponsor workshops focused on green alternatives and MACT compliance • Assess reduction of TCE use
Grant Summary • Target smaller business because: • May not have information and resources • May not have in-house technical expertise • TURI grant recipient – cleaning lab and alternatives chemistry expertise • OTA subcontractor – on-site company assistance in TUR and MACT compliance, process and technology options ID
Outreach - TCE Users • OTA/TURI identified 95 facilities as potential TCE users • List of facilities assembled from • EPA Vapor Degreasing MACT standard notifiers (38) – thought to be in business • OTA previously provided TA on chlorinated solvent use (24) • TURI previously provided cleaning lab services (17) • Previous TURA reporter for solvent (16)
Outreach – TCE Users (continued) • Each of the 95 companies received an outreach letter and follow-up phone calls to offer information and assistance • Additional mailings and telephone campaign to 100’s of other companies in plating, machining and metal intensive industries
Outreach - Outcomes • Dozens of companies received over-the-phone assistance on green alternatives and compliance assistance • Approximately 10 companies received on-site assistance – cleaning chemistry and process technology alternatives and MACT compliance • Over 25,000 pounds of chlorinated solvent use eliminated
Participant Survey Conducted at Project Completion • Purpose of survey to identify the obstacles to reducing/eliminating TCE use • Identify what motivates companies to reduce use and implement alternatives • Make policy recommendations on how to promote further reductions in TCE use at Massachusetts companies
Companies Targeted for Survey • 56 Companies appropriate to contact for survey • 21 Companies were contacted by letter and phone and did not respond • 4 Companies wanted to complete survey in writing and did not return survey • 1 Company never used chlorinated solvent • 30 Companies completed the survey • 54% completion rate of appropriate companies
Data Organized & Evaluated in Three Categories • Companies that have eliminated chlorinated solvent use (CSU) • Companies that have reduced CSU • Companies that have neither eliminated nor reduced CSU
Motivation - Companies that have Eliminated CSU • Regulations (78%) • Environmental health and safety (56%) • Cost efficiency(22%) • Management drivers (22%) • Customer requirements (11%)
Obstacles - Companies that have Eliminated CSU • Maintaining quality (78%) • Extra process time - alternative system (67%) • Additional cost (33%) • Employee training needs (22%) • Customer requirements (11%) • Space of alternative system (11%) • Ability to use existing custom equipment (11%)
Motivation – Companies that have Reduced CSU • Cost efficiency (58%) • Regulations (50%) • Cleaner EH&S policy (33%) • Customer requirement (25%) • Management drivers (25%) • Equipment upgrades needed anyway (25%)
Obstacles – Companies that have Reduced CSU • Maintaining quality (83%) • Additional cost (58%) • Customer requirement (33%) • Employee training needs (25%) • Unique process/product (17%) • Lack of proven alternative (8%)
Motivation – Companies that have not Reduced or Eliminated CSU • Regulations (56%) • Cost Efficiency (44%) • EH&S (44%) • Customer Requirement (11%) • Need to upgrade equipment anyway (11%) • Considering outsourcing (11%)
Obstacles - Companies that have not Reduced or Eliminated CSU • Maintain quality (100%) • Additional Cost (44%) • Lack of proven alternative (22%) • Management cooperation (11%) • Customer requirement (11%) • Unique process/product (11%) • Too busy to evaluate alternatives (11%) • Process time for new system (11%) • Waste management issues (11%)
What’s Next? • Complete analysis and interpretation of data collected • Look for trends - motivation and obstacles to implementation • Develop policy recommendations to promote further reduction in chlorinated solvent use in Massachusetts