Download
1 / 28
280 likes | 562 Vues
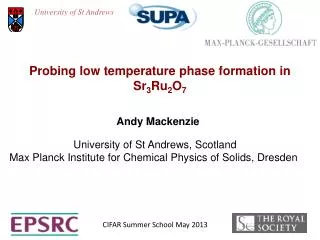
University of St Andrews. Probing low temperature phase formation in Sr 3 Ru 2 O 7. Andy Mackenzie. University of St Andrews, Scotland Max Planck Institute for Chemical Physics of Solids, Dresden . CIFAR Summer School May 2013. Sources.

E N D
University of St Andrews Probing low temperature phase formation in Sr3Ru2O7 Andy Mackenzie University of St Andrews, Scotland Max Planck Institute for Chemical Physics of Solids, Dresden CIFAR Summer School May 2013
Sources S.A. Grigera et al., Phys. Rev. B 67, 214427 (2003). R.S. Perry et al., Phys. Rev. Lett. 92, 166602 (2004). S.A. Grigera et al., Science 306, 1154 (2004). R.A. Borziet al., Science 315, 214 (2007). A.W. Rost et al., Science 325, 1360 (2009). A.W. Rost et al., Proc. Nat. Acad. Sci. 108, 16549 (2011). D. Slobinsky et al., Rev. Sci. Inst. 83, 125104 (2012). A.W. Rost, PhD thesis, University of St Andrews http://research-repository.st-andrews.ac.uk/handle/10023/837
Contents Introduction: discovery using resistivity of new phenomena in Sr3Ru2O7. 2. Measuring magnetisation using Faraday force magnetometry. 3. A.c. susceptibility as a probe of first order phase boundaries. 4. Using the magnetocaloric effect to measure field-dependent entropy. 5. Probing second order phase transitions with the specific heat. 6. Summary.
Magnetoresistance of ultra-pure single crystal Sr3Ru2O7 T = 100 mK l = 3000 Å R.S. Perry et al., Phys. Rev. Lett. 92, 166602 (2004).
Does this strange behaviour of the resistivity signal the formation of one of more new phases? T = 100 mK l = 3000 Å
Low temperature magnetisation of Sr3Ru2O7 T ~ 70 mK ΔM ~ 10-4 (μB/Ru)/√Hz 2 cm Lightweight plastic construction Faraday force magnetometer: Sample of magnetic moment m experiences a force if placed in a field gradient: Detection of movement of one plate of a spring-loaded capacitor. D. Slobinsky et al., Rev. Sci. Inst. 83, 125104 (2012).
Low temperature magnetisation of Sr3Ru2O7 T ~ 70 mK ΔM ~ 10-4 (μB/Ru)/√Hz 1 cm Three distinct ‘metamagnetic’ features, i.e. superlinear rises in magnetisation as a function of applied magnetic field. Are any of these phase boundaries?
Probing first-order phase transitions using mutual inductance Voltage induced in red pick-up coil due to time-varying field produced by blue drive coil. as an amplitudeproportional to pick-up coil area A, number of turns n and measurement frequency and a phase (for ideal mutual inductance 90 degrees) Two coils, opposite sense of connection implies zero signal; classic null method.
Possibility of a dissipative response Now insert a sample in one coil: you get a complex signal back depending on the properties of the sample. ’’ Real part of a.c. magnetic susceptibility due to ideal response of the sample: where M is the sample magnetisation (neglecting subtle dynamical effects). Imaginary part which will only appear due to dissipation on crossing a 1st order phase boundary. N.B. Dissipation in an a.c. measurement has the same roots as hysteresis in a d.c. one.
State-of-the-art a.c. susceptibility Coil craft: Alix McCollam, Toronto Twin ‘pickup’ coils each > 1000 turns of insulated Cu wire 10 μm in diameter; one contains the crystal. ‘Modulation’ coil of superconducting wire providing a.c. field h0up to 100 G r.m.s. at 20 Hz Cryomagnetic system: 18 T superconducting magnet, base T25 mK, noise floor ~10pV/√Hz @ baseT, maximum B
Key challenge in real life: establishing the absolute phase Problem – signal amplification system contains unknown capacitance and inductance, so the absolute phase of the signal is not easily known: ’’ ’’ X and Y channels of lock-in will both contain components of both and is ubiquitous but is rare, try to find by maximising and check very carefully if this leaves you any signal at in the channel. If it does, there is some dissipation.
Susceptibility results from ultrapure Sr3Ru2O7 T = 1 K T = 500 mK T = 100 mK Examination of temperature and field dependence validates phase analysis. R.S. Perry et al., Phys. Rev. Lett. 92, 166602 (2004). S.A. Grigera et al., Science 306, 1154 (2004). R.A. Borziet al., Science 315, 214 (2007).
Direct comparison between susceptibility and resistivity T = 100 mK Susceptibility signal corresponding to the broad low-field metamagnetic feature Sharp changes in resistivity correspond to first order phase transitions R.S. Perry et al., Phys. Rev. Lett. 92, 166602 (2004).
Susceptibility results from ultrapure Sr3Ru2O7 T = 1 K T = 500 mK T = 100 mK Examination of temperature dependence validates phase analysis. R.S. Perry et al., Phys. Rev. Lett. 92, 166602 (2004). S.A. Grigera et al., Science 306, 1154 (2004). R.A. Borziet al., Science 315, 214 (2007).
The low temperature phase diagram of Sr3Ru2O7 mark I 1.2 S.A. Grigera et al., Science 306, 1154 (2004). 0.8 T(K) 0.4 0 7.7 7.9 8.1 8.3 oH (T) Outward curvature was a surprise – if these really are first order transitions, the magnetic Clausius-Clapeyron equation implies that the entropy between the two phase boundaries is higher than that outside it. Unusual (though not unprecedented) for a phase.
Independent measurement of entropy change as a function of magnetic field ‘Any method involving the notion of entropy, the very existence of which depends on the second law of thermodynamics, will doubtless seem to many far-fetched, and may repel beginners as obscure and difficult of comprehension.’ W. Gibbs (1873)
The magnetocaloric effect Kevlar Strings (35 @ 17μm) Under adiabatic conditions Thermometer (Resistor) This is just the principle that governs the cooling of cryostats by adiabatic demagnetisation; here we use it to determine the field change of entropy. Silver Platform with sample on other side CuBe Springs Copper Ring 2 cm A.W. Rost, PhD thesis, University of St Andrews http://research-repository.st-andrews.ac.uk/handle/10023/837
Two different modes of operation Adiabatic conditions; 1st order transition at to Non-adiabatic conditions (can be controlled by coupling sample platform to bath with wires of known thermal conductivity).
T [mk] H [T] Sample raw Magnetocaloric Effect data from Sr3Ru2O7 Sharper features associated with first order transitions ‘Signs’ of changes confirm that entropy is higher between the two first order transitions than outside them. Metamagnetic crossover seen in susceptibility
Quantitative thermodynamic consistency Entropy jump at first order phase boundary from direct analysis of MCE data Entropy jump determined independently from magnetisation data and ClausiusClapeyron relation
Two phase boundaries definitely established S.A. Grigera et al., Science 306, 1154 (2004). 1.2 0.8 T(K) A.W. Rost et al., Science 325, 1360 (2009). 0.4 0 7.7 7.9 8.1 8.3 oH (T) Green lines definitely first-order transitions; what about the ‘roof’? For this, the experiment of choice is the heat capacity.
Our specific heat rig – just the magnetocaloric rig plus a heater. Kevlar Strings (35 @ 17μm) Thermometer (Resistor) Heater is a 120 Ω thin film strain gauge attached directly to the sample with silver epoxy Silver Platform with sample on other side CuBe Springs Copper Ring 2 cm
The relaxation time method for measuring specific heat No heat Heat at constant rate No heat Time constant of decay in stage 3 is proportional to C/k where C is the sample heat capacity and k is the thermal conductance of the link to the heat bath. This ‘relaxation’ measurement principle is used in the Quantum Design PPMS.
Specific heat on cooling into the phase μoH = 7.9 T 1.2 0.8 T(K) 0.4 0 7.7 7.9 8.1 8.3 oH (T) Clear signal of a second order phase transition but against the unusual background of a logarithmically diverging C/T.
Rising C/T is a property of the phase and not its surroundings 1.2 7.9 T 0.8 T(K) 0.4 11 T 6 T 0 7.7 7.9 8.1 8.3 oH (T) Although the phase is metallic it seems to be associated with degrees of freedom additional to those of a standard Fermi liquid. A.W. Rost et al., Proc. Nat. Acad. Sci. 108, 16549 (2011).
Third boundary established – this is a novel quantum phase S.A. Grigera et al., Science 306, 1154 (2004). 1.2 0.8 T(K) A.W. Rost et al., Science 325, 1360 (2009). 0.4 0 7.7 7.9 8.1 8.3 A.W. Rost et al., Proc. Nat. Acad. Sci. 108, 16549 (2011). oH (T) Green lines are first-order transitions, dark blue are second order.
The bigger picture Phase appears to have a nematic order parameter and to form against a background of quantum criticality. A.P. Mackenzie et al., Physica C 481, 207 (2012)
University of St Andrews Summary • The magnetocaloric effect, a.c. susceptibility and the specific heat are all effective probes of the formation of novel quantum phases. Moral • Microscopics are all well and good, but never forget the power of thermodynamics in investigating many-body quantum systems. CIFAR Summer School May 2013


![Jevgenia Viktorova University of St Andrews E-mail: jv2 [ät] st-and.ac.uk](https://cdn1.slideserve.com/2142580/international-relations-approaches-issues-and-analysis-lecture-5-critical-post-structuralist-ir-dt.jpg)