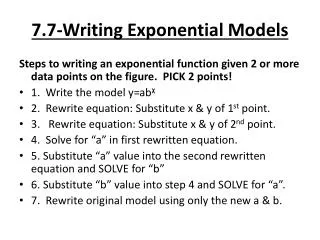
Fitting Exponential Models
Fitting Exponential Models. Integrated Math 4 Mrs. Tyrpak. Recall Fitting Linear Models. Least squares regression is used to fit data to a line. Let us review this process. Red distance: Residual y=1.6x. Least Squares Regression. Sum of squared residuals = 5.2.

Fitting Exponential Models
E N D
Presentation Transcript
Fitting Exponential Models Integrated Math 4 Mrs. Tyrpak
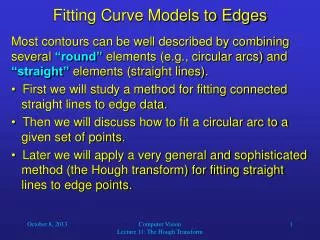
Recall Fitting Linear Models Least squares regression is used to fit data to a line. Let us review this process. Red distance: Residual y=1.6x
Least Squares Regression Sum of squared residuals = 5.2
Let’s see how this process works on exponential functions… Consider the following 2 functions:
Least Squares Regression Sum of squared residuals = 4
Least Squares Regression Sum of squared residuals = ____
Let’s use the calculator to find the exponential model Notice our calculator did NOT give us the function with the sum of the least squares.
Think about it… What are some reasons you can think of that the calculator did not give the expected function for regression? What can we do to the data so the least squares regression method will work?
Linear Regression: on transformed data So for (x, y*) Substitute log(y) for y* and solve for y.
Summary of Calculator Steps • The calculator linearizes the data by taking the logarithm of each y value • The calculator performs linear regression on the transformed data. (x, log(y)) • The line of regression is solved for y.
Thanks for your attention! Don’t forget to complete both the extension and enrichment assignments before you move on. Keep up the hard work!