Download
1 / 16
160 likes | 277 Vues
yr21-01-10 00Z. yr21-01-11 00Z. yr21-01-12 00Z. Extratropical stratoshere-troposphere exchange in a 20-km-mesh AGCM. Ryo Mizuta (Meteorological Research Institute / AESTO) Hiromasa Yoshimura (Meteorological Research Institute) E-mail: rmizuta@mri-jma.go.jp. Introduction.

E N D
yr21-01-10 00Z yr21-01-11 00Z yr21-01-12 00Z Extratropical stratoshere-troposphere exchange in a 20-km-mesh AGCM Ryo Mizuta (Meteorological Research Institute/ AESTO) Hiromasa Yoshimura (Meteorological Research Institute) E-mail: rmizuta@mri-jma.go.jp
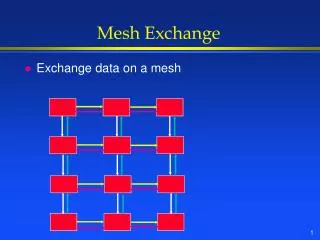
Introduction • Transport and mixing processes around UTLS region includes very fine filamental structures, but these cannot be simulated by conventional GCMs. • We had to restrict to regional models or two dimensional models in order to represent these processes. Water vapor image(Meteosat) Isentropically advected “controur” of PV isolines of 4 days before Appenzeller et al. (1996)
AGCM with the grid size of 20km • Long-term simulations by a high-resolution AGCM improve the representation of regional-scale phenomena like tropical cyclones and that of local climate, due to better representation of topographical effects and physical processes. OBS Model Surface temperature climatology Precipitation climatology OBS Model
L • In addition to near-surface phenomena, the model can resolve • sharp tropopause • filamental structures near the tropopause yr21-01-10 00Z L PV 315K [PVU=10-6Km2s-1kg-1 ] yr21-01-11 00Z L • Using this high-resolution model, we have investigated • where and how the transport and mixing occur • what depends on the model resolutions PV Water Vapor yr21-01-12 00Z
Climate Simulation on the Earth Simulator • JMA/MRI AGCM -- used both for the operational numerical weather prediction and climate researches • TL959 (grid size of about 20km, 1920x960) • 60 vertical layers with top at 0.1hPa (interval is ~900m at 250hPa) • Dynamics: Semi-Lagrangian Scheme (Yoshimura, 2004) • Cumulus parameterization:prognostic Arakawa-Schubert (Randall and Pan,1993) • Radiation: Shibata et al. (1999), Gravity wave drag: Iwasaki et al. (1989) • Time integrations over 20 years (as the “control” run against the global warming simulation) using climatological SST • Pick up one January and one July of a certain year because very huge data size is required • The horizontal resolution dependence is also examined using the coarse resolution (200km) model (TL95L40, almost the same settings as the TL959 model). spin-up 20-year integration Jan Jul
Model Climatology zonal-meanU・T (DJF) ERA40 Reanalysis(1979-1998) TL959L60 (20years) TL959L60 – ERA40 + - ■■ 95% significant difference • The model's ability of simulating the present-day climate has been confirmed from global scale through small scale in the sense of seasonal mean (Mizuta et al. 2006).
Model Climatology Jet stream Storm tracks U300 [m/s] NH DJF stddev of Z300 2.5-6days bandpass-filtered (DJF) ERA40(1979-1998) TL959L60 (20years)
χ= 1 at PV > 2 (PVU) χ= 0 at PV < 2 (PVU) Quantification of Transport by Passive Tracer Advection 1. Tracer initialized to 1 only above the 2PVU tropopause 2. Tracer advection for 24 hours without source/sink 3. Compare with the tropopause at final time Gray (2006) χ at PV < 2 : ST 1 – χ at PV > 2 : TS • Semi-Lagrangian advection scheme, same as the model dynamical core • 3D online calculation • initialized to 0 or 1 at 00UTC every day • Averaged over 30-day calculations Day 1 2 3 4 30 31
Vertical distribution (20N-90N, Jan) Strat. Trop.Trop. Strat. Net TL959 TL95 TL959 TL95 TL95 TL959 • Less transport in each direction above 400hPa in the high-resolution model, but more exchange below 500hPa. • Net transport does not much depend on model resolution. Vertically integrated amount is consistent with the residual mean stratospheric circulation (1-2 x 10¹⁰ kg/s S T)
Exchange in the lower levels • Exchange in the lower levels is not well simulated in the low-resolution model, because tropopause folding is simulated only in the high-resolution model. • less exchange in the lower level of the low-resolution model. TL959 TL95 ---- PV=2PVU yr21-01-11 00Z TL959
StratosphereTroposphereTroposphereStratosphere Horizontal Distribution (Jan) 200-350hPa • TS transport around the subtropical jet over Eurasia • ST transport in northern winter around the storm tracks at lower altitude 400-700hPa
July TL95 TL95 TL95 TL959 • Vertical distribution is similar to January, with upward shift of the peak because of higher tropopause • Transport occurs mainly around the Pacific and the Atlantic at 200hPa, due to Rossby wave breaking (Postel and Hitchman 1999) • weaker in the lower altitudes due to weak storm activity TL959 TL959 Strat. Trop.Trop. Strat. Net 150-200hPa 250-450hPa
Contributions of the PV nonconservative terms • A nonconservative process has to work for transport across PV surface will move to the stratosphere in Δt • Gravity-wave drag • Convective momentum transport • (Diffusion) • Shortwave Radiation • Longwave Radiation • Heat release by Large-scale condensation • Heat release by Convection • (Diffusion) --- stored as monthly-averaged data (except for diffusion) will move to the troposphere in Δt
Contributions of the PV nonconservative terms Jan Jul • Estimated transport by the effect of longwave can explain over half of TST • The other contributions are too small to explain the transport
Summary • Amount of exchange estimated by passive tracer has resolution dependence. In the high-resolution model, • less exchange at higher levels--- due to better representation of sharp tropopause • more exchange at lower altitudes--- due to better representation of small-scale structures • net transport have small resolution dependence • Net stratosphere to troposphere transport below 400hPa • large over the Pacific and Atlantic storm track in January • Net troposphere to stratosphere transport above 300hPa • near the subtropical jet over Eurasia in January • around the Pacific and the Atlantic in July • Large part of this transport estimated from PV change by vertical difference of longwave radiation. Please check Mizuta and Yoshimura (2009, JGR) for more detail !