Download
1 / 40
400 likes | 545 Vues
Simulations of fast Crab Cavities failures in the HL-LHC . Bruce Yee Rendón. Departamento de Física Centro de Investigación y de Estudios Avanzados del Instituto Politécnico Nacional Unidad Zacatenco. Acknowledgments: J. Barranco, F. Bouly ,R. Bruce, R. Calaga, F. Carra, A. Lechner,

E N D
Simulations of fast Crab Cavities failures in the HL-LHC Bruce Yee Rendón Departamento de Física Centro de Investigación y de Estudios Avanzados del Instituto Politécnico Nacional Unidad Zacatenco Acknowledgments: J. Barranco, F. Bouly ,R. Bruce, R. Calaga, F. Carra, A. Lechner, R. Lopez Fernandez, A. Marsilli, D. Wollmann, F. Zimmermann, US-LARP and Conacyt.
Scheme • Introduction • Results • Summary
CC • A device called “crab cavity” (CC) applies a tiny sideways kick to each particle bunch in order to change its dynamics to achieve a head-on collision at the IP. For the HL-LHC the peak of the luminosity will be increased by factor of 10 (with respect to the nominal). CCs that close the crab bump CCs that open the crab bump Figure 1 . The effect of the CC in the beam at interaction point in the LCC scheme.
HL-LHC optics parameters TABLE I: Relevant optics parameters of HL-LHC under study.
LHC safe operation The Stored energy in the HL-LHC beam at 7 TeV is 692 MJ . 2. 5% of a single beam is beyond the damage of the superconducting magnets . The safe beam extraction is in 3 turns (~300μs). Courtesy J. Wenniger Figure 2: Sequence of a failure detection and full beam extraction in the LHC.
CC failure at KEKB klystron power out cavity voltage cavity phase beam current 100 μs Courtesy K. Nakanishi Figure 3: Crab Cavity failures at KEKB. The cavity voltage decay to zero after 100 μs (~ 1 LHC turn).
Collimations studies • Collimation system is designed to protect the LHC lattice from unwanted beam losses. • We used the Collimations tools to evaluate the beam losses produce by the CCs failures. The losses can be classified as : • Particles that impacts in the Collimators (TCPs, TCSGs, etc). • Particles that impacts in the aperture of the LHC lattice (cold magnets, warm magnets, etc).
Layout of the CC Courtesy R. DeMaria Figure 4 . Scheme layout at the right side of the IP for the LHC . TABLE II: The CCs settings used for this studies .
CC operation Voltage Adiabatic Ramping up Turns Phase Turns Figure 5. Normal operation represent the ideal performance of the CC.
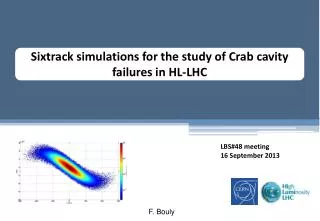
Crab plane • The CCs tilt the bunch in the transverse plane to achieve a head-on collision: The horizontal plane at CMS (IP5) and vertical plane at ATLAS (IP1). • This study is with emphasis in the losses at horizontal plane, therefore, the failures is just produce in one of the CCs which close the bump at CMS. The CCs at IP1 were turn off in all the simulations. • A study with CCs working in both planes were realized by F. Bouly*. *F. Bouly. Sixtrack simulations for the study of Crab cavity failures in HL-LHC, LBS #48, 2013.
Maximal displacement • T.Baer* found that maximal displacement for a CCs failure in voltage or phase was around 1.5σx at 2.4 σz position for voltage and 0 σz for phase . • In our CCs failures we found a maximal displacement 1.6 σx at 2.4 σz for the voltage and 2.2 σx at 0 σz for phase. Figure 6. The maximal transverse displacement produced by a failures of one CC voltage that close up the bump for particles at different longitudinal positions. The failures begin in the turn 1. *T. Bear et al. Very Fast LHC Crab Cavity Failures and their Mitigations, 2012.
Beam distributions • A new 2D Gaussian with matching conditions were used to generated the beam distribution. • Two kind of halo distributions were implemented and studied: • a) Tiny halo : Horizontal halo at different positions with a smear of 0.1σ, a complete vertical and longitudinal beam distribution. • b) Thick halo: Horizontal and vertical halo with different smears and with a complete beam distribution in the longitudinal phase space.
Tracking to reach the SSs Figure 7. The histogram of the particles that impacts in the collimators for the first and last turns of the tracking to reach a realistic steady-state for the beam distributions. Most of the particles are hit at TCP.C6L7.B1.
CC operation cases Figure 8. The schematic way of changing the voltage and phase through the numbers of turns during the tracking , once the Steady-state is reached.
Tiny halos Figure 9 . The phase space using a 2D Gaussian with a tiny horizontal halo at 5.5 σ with a smear of 0.1 σ . A complete full beam distribution in the vertical and longitudinal phase space.
Percentage of the beam that hit in the collimators for the tiny halos Figure 10 . The percentage of the beam that impacted in the collimators using horizontal halos at different positions with a smear of 0.1 σ, for the PF , VF and NO cases.
Percentage of the beam that hit in the aperture for the tiny halos Figure 11 . The percentage of the beam that impacted in the aperture using horizontal halos at different positions with a smear of 0.1 σ, for the PFVF and NO cases.
Thick distribution phase space I SS I SS II Figure 12. The phase space for the SS I and II .
Thick distribution phase space II SS III SS I V Figure 13. The phase space for the SS III and IV .
Energy simulated TABLE III: The equivalent energy stored corresponding to the fraction that represent each SS with respect to a HL-LHC full beam*. *Assuming that total stored energy at 7 TeV is 692.84 MJ,.
The percentage of the beam that hit in the collimators from the SS II Figure 14. The percentage of the beam that impacted turn by turn in the collimators after the failure started for the PF and VF cases using the SS II distributions.
Total beam percentage that impacted for the SS II TABLE IV: The percentage of beam that hit in the aperture and collimators, integrated over all the remains turns after the failures for the PF and VF cases using SS II.
The percentage of the beam that hit in the collimators from the SS III Figure 15. The percentage of the beam that impacted turn by turn in the collimators after the failure started for the PF and VF cases using the SS III distributions..
Total beam percentage that impacted for the SS III TABLE V :The percentage of beam that hit in the collimators, integrated over all the remains turns after the failures for the PF and VF cases using SS III. Only the PF in 1 turn produced beam that hit in the aperture of 6.2 ± 3.1 x 10⁻⁵ %.
Total beam percentage that impacted for the SS IV TABLE VI:The percentage of beam that hit in the collimators, integrated over all the remains turns after the failures for the PF cases using SS IV No beam losses were generated for the VF cases. In addition, the impacts were record just in the collimators.
PVF cases Figure 16. The schematic view of the PVF failures simulated in this study.
PVF results TABLE VII : The percentage of beam integrated deposited over all the 10 turns after the failures for the PVF using SS II and SS III in the collimators. No beam losses were generated for the other SS cases. The losses were only in the collimators.
Global Inefficiency TABLE VIII: The Global Inefficiency for the different CCs failures cases. The global inefficiency is the number of the particles lost in the aperture divided by the total lost (in the collimators and aperture). The value for the normal operation of the LHC is 3 x 10 -4 using a halo at 6 σ*. *A. Marsili. Collimator alignment error models in SixTrack, ColUS Meeting, Nov 2013
LLM for the SS II Figure 17. The Local loss Map using the SS II, for the PF in 1 turn close up at IR7. Figure 17. The Local loss Map using the SS II, for the PF in 1 turn.
LLM for the SS III Figure 18. The Local loss Map using the SS III, for the PF in 1 turn. Figure 18. The Local loss Map using the SS III, for the PF in 1 turn close up at IR7.
Mitigation strategies IP5 Drop the voltage, linearly in the next turns, to zero Failure CC s Figure 19. The scheme layout for mitigation cases . In case the voltage failure the CC that close the bump will drop to zero. Indeed, for phase failure the voltage of the CC which fail and the one which close the bump, both will drop to zero.
Mitigation results TABLE IX : The percentage of reduction of the beam loss for the PF and VF cases using the SS II and SS III in the collimators after applications of the mitigation strategies. In these simulations the mitigation started one turn after the failure is produced and took 3 turns to drop the voltage to zero. Dropping linearly the voltage in 9 turns the beam reduce ~71% for the PF1 in SSIII . Dropping exponentially the voltage (τ= 9 LHC turns ) in 9 turns the beam reduce ~65% for the PF1 in SSIII .
Summary I • This study present the first results of the CCs using a more realistic steady-state in the LHC. • The SSII and SS III represent the most interesting cases , cause they are the ones with tails distribution in the horizontal plane. The SS III represent more percentage of the full beam than SS II. • Previous studies of the quench test (2013) show that highest load in the TCP is 100 kW during 10 s, which mean 1 MJ. In order to have upper limit for the energy deposited in the collimators for our simulations, we can assume that all the energy of the particle which impact in the collimator was deposited , therefore, in the worst case ( for PF1 using SIII) , we deposited 10 k J over a time of 100 μs.
Summary II • Assuming that: • a) The material properties of the collimators remains constant between • room temperature and 150̊ C . • b) Neglecting the thermal diffusion. • c) For the same FLUKA map. • And remembering the dynamic stresses peaks can be considered around 2 times larger than the static stresses *. This case would induce a maximum stress of the 2% of the material elastic limit **.However, Fluka studies are required to calculated the energy deposited in the collimators. • A FLUKA calculations are need to asses the energy density in the magnets***. The energy necessary to quench a standard magnet is around 20 mJ/cm3 • *A. Bertarelli et al. “THERMALLY INDUCED VIBRATIONS OF BEAMS: LONGITUDINAL AND FLEXURAL BEHAVIOUR”, Journal of Applied mechanics. • **private communication by F. Carra and R. Bruce • ***Private Communication with A. Lechner and D. Wollmann.
Summary III • The global inefficiency for the normal LHC performance is 3 x 10 -4 . In the Crab Cavities the value obtained for the Steady-State and theirs failures are in the order of 10 -4 . Therefore, the CCs do not increase dramatically the global inefficiency in the LHC. The failures of the CCs does not change the impact parameters on the collimators at IR7. • For the abrupt CCs failures the beam losses simulated remains in the threshold of safety operation. Nevertheless, the population in our beam tails were 0.03 % (> 4σ). In the LHC overpopulate tails were observed 5 %*. This represent 2 order of magnitude higher in the energy deposited (at least on collimators) that will represent a serious threat for the LHC lattice. • * F. Burkart, Halo Scraping with collimators in the LHC, CERN-AB-NOTE-2004-054(ABP), 2004.
Collimators settings TABLE X: The Collimators settings used for the HL-LHC studies . Similar to Collimation team settings*, the only difference is that they have open the TCLP and TCLI. *A. Marsilli et al. Collimation cleaning with ATS optics for HL-LHC, Collimation Review, May, 2013.