
The TIROS Program: Pioneering Satellite Weather Observation from 1960 to Present
E N D
Presentation Transcript
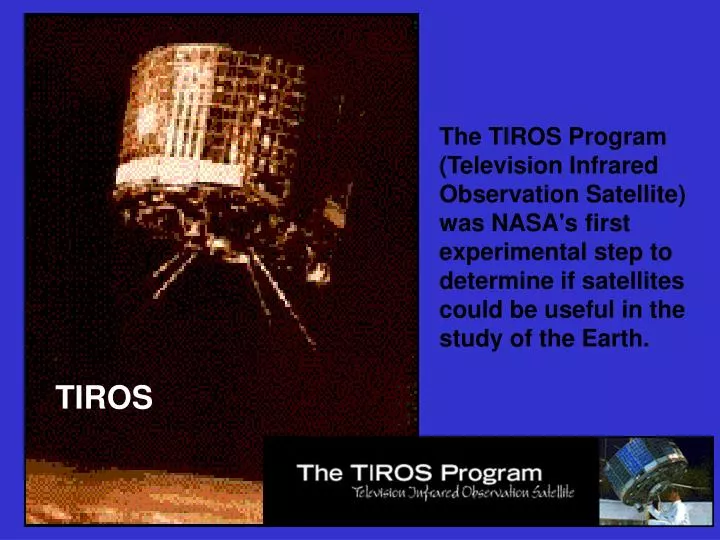
The TIROS Program (Television Infrared Observation Satellite) was NASA's first experimental step to determine if satellites could be useful in the study of the Earth. TIROS
1960 2010
The images above show the stark contrast between the first image beamed down from TIROS-1 on April 1, 1960 and the full-color full-Earth images that GOES-8 produces every three hours. But, if it hadn't been for TIROS and the TIROS experiment, there would be no GOES images today.
GOES-13 GOES-13/O/P has similar instruments to GOES-8-12, but on a different spacecraft bus. Spring and fall eclipse outages will be avoided by larger onboard batteries. Improved navigation Improved radiometrics GOES-8/12 GOES-13/O/P
GOES-12/13 (During eclipse) GOES-13 GOES-12 Figure courtesy of S. Bachmeier, CIMSS
Satellites Geostationary Satellites GOES 8-12 Geostationary satellites were placed in orbit over the equator; they remain fixed over a point. To keep the satellite in place over Earth the satellite must orbit at a farther distance than polar orbiters (35,000 km). Some resolution is lost but the static orbit makes these very powerful satellites.
Satellites Polar Satellites Polar orbiting satellites orbit the globe at low altitudes (a few hundred km) which allows them to complete one pass in 100 minutes. With such a quick orbit the satellite can capture two sweeps of the globe in 24 hours.
NESDIS NOAA's National Environmental Satellite,Data and Information Service NESDIS operates the satellites and manages the processing and distribution of millions of bits of data and images these satellites produce daily. The prime customer for the satellite data is NOAA's National Weather Service, which uses satellite data to create forecasts for television, radio, and weather advisory services. NOAA's operational environmental satellite system is composed of: geostationary operational environmental satellites (GOES) for short-range warning and "nowcasting," and polar-orbiting environmental satellites (POES) for longer term forecasting. Both kinds of satellites are necessary for providing a complete global weather monitoring system. The satellites carry search and rescue instruments, and have helped save the lives of about 10,000 people to date. The satellites are also used to support aviation safety (volcanicash detection), and maritime/shipping safety (ice monitoring and prediction).
SARSAT Around the world...around the clock...NOAA proudly stands watch. As an integral part of worldwide search and rescue, NOAA operates the Search & Rescue Satellite Aided Tracking (SARSAT) System to locate those in distress almost anywhere in the world at anytime and in most conditions.The SARSAT system uses NOAA satellites in low-earth and geostationary orbits to detect and locate aviators, mariners, and land-based users in distress. The satellites relay distress signals from emergency beacons to a network of ground stations and ultimately to the U.S. Mission Control Center (USMCC) in Suitland, Maryland. The USMCC processes the distress signal and alerts the appropriate search and rescue authorities to who is in distress and, more importantly, where they are located. Truly, SARSAT takes the "search" out of search and rescue.
GOES-13/14/15 (N/O/P, 2010 to 2020) • Geostationary Operational Environmental Satellite • GOES-13 is currently GOES-East / • GOES-14 is GOES-WEST • Imager has five channels • Visible at 1 km spatial resolution • Shortwave IR, Water Vapor, Clean IR Window at 4 km • Dirty IR Window at 8 km on 13, 4 km on 14/15 • Depending on scan strategy, new CONUS image every 15 minutes • Sounder has nineteen channels • One visible channel, 18 infrared channels for temperature and moisture soundings, including 3 water vapor channels and one ozone channel, all at approximately 8 km resolution • Available approximately once per hour, US only
GOES-R/S Series (2017 to 2028) • Launching in 2016, GOES-R is expected to be GOES-West • Two meteorological instruments • The Advanced Baseline Imager (ABI) will provide • 5x more frequent scans (5 minute for full disk, 30 second refresh for single mesoscale sector), • 4x improved temporal resolution (2 km at sub-satellite point, except 0.5 km visible), and • 3x more spectral channels (16 total, including 4 in the near-IR and 10 in the IR) than currently on GOES-13/14/15 (N/O/P) • An optical sensor on the Geostationary Lightning Mapper (GLM) will provide continuous lightning flash rates • No Sounder!
ABI Current Spectral Coverage 16 bands 5 bands Spatial resolution 0.64 mm Visible 0.5 km Approx. 1 km Other Visible/near-IR 1.0 km n/a Bands (>2 mm) 2 km Approx. 4 km Spatial coverage Full disk 4 per hour Scheduled (3 hrly) CONUS 12 per hour ~4 per hour Mesoscale Every 30 sec n/a Visible (reflective bands) On-orbit calibrationYes No The Advanced Baseline Imager:
ABI Visible/Near-IR Bands Schmit et al, 2005
ABI IR Bands Schmit et al, 2005
Visible and near-IR channels on the ABI Snow, Phase Part. size Cirrus Veg. Haze Clouds The ABI visible and near-IR bands have many uses.
Using satellite observations (MODIS, MET-8 and AIRS) to simulate the ABI
The additional bands on the Advanced Baseline Imager (ABI) allow new or improved products Cirrus Clouds Clouds, etc Aerosols Vegetation “0.47 m” “0.64 m” “0.86 m” “1.38 m” Snow, Cloud phase Fog, Fires, clouds, etc Water Vapor, Precip. Particle size “1.61 m” “2.26 m” “3.9 m” “6.19 m” WV, Upper-level SO2 Vol. Ash, Cloud phase Total Ozone Water Vapor “6.95 m” “7.34 m” “8.5 m” “9.61 m” Low-level Moisture Surface features, clouds Clouds, Precip., SST Cloud heights “10.35 m” “11.2 m” “12.3 m” “13.3 m”
ABI scans about 5 times faster than the current GOES imager There are two anticipated scan modes for the ABI: - Full disk images every 15 minutes + 5 min CONUS images + mesoscale. or - Full disk every 5 minutes.
ABI can offer Continental US images every 5 minutes for routine monitoring of a wide range of events (storms, dust, clouds, fires, winds, etc). This is every 15 or 30 minutes with the current GOES in routine mode.
“Franklin” Mesoscale images every 30 seconds for rapidly changing phenomena (thunderstorms, hurricanes, fires, etc). Current GOES can not offer these rapid scans while still scanning other important regions
Imager Coverage in ~30 minutes Full Disk N. Hemisphere CONUS Mesoscale
GOES Figure courtesy of K. Bedka and W. Feltz, CIMSS
“ABI” Figure courtesy of K. Bedka and W. Feltz, CIMSS
Simulated ABI Band 8 (6.19 µm) Weighting function for US Standard profile indicates sensitivity to upper tropospheric moisture
Simulated ABI Band 9 (6.95 µm) Weighting function for US Standard profile indicates sensitivity to upper middle tropospheric moisture
Simulated ABI Band 10 (7.34 µm) Weighting function for US Standard profile indicates sensitivity to lower middle tropospheric moisture
Simulated ABI Band 12 (9.61 µm) Weighting function for US Standard profile indicates sensitivity to ozone
Building an RGB: Band 8 – Band 10 Red with alpha gradient (upper – lower tropospheric moisture different), white with alpha gradient (clouds)
Building an RGB: Band 12 – Band 13 Green with alpha gradient (brighter high ozone concentration indicative of lower potential vorticity surfaces)
Building an RGB: Band 8 Inverted Blue with alpha gradient (brighter blues indicate dryer upper tropospheric air, dry slot)
Building an RGB: Composite Composite clearly indicates trough over western United States, dry slot, and differential tropospheric moisture
GOES-R ABI will detect SO2 plumes Water Vapor Band Difference convolved from AIRS data sees SO2 plume from Montserrat Island, West Indies SO2 Plume Current GOES Imager No skill in monitoring Figure courtesy of Kris Karnauskas Current GOES Imager can not detect SO2 ABI 7.34 μm – 13.3 μm
Synthetic 2 km GOES-R ABI WV Imagery • Waves are evident in all three ~2 km ABI WV channels, with wave spatial patterns being far clearer than current GOES-12 • 3 ABI WV channels could provide information on mountain wave amplitude, as they detect peak signal from differing heights Observed GOES-12 Band 3 (6.5 micron) Simulated ABI Band 8 (6.2 micron) Figure courtesy of K. Bedka and W. Feltz, CIMSS Simulated ABI Band 9 (7.0 micron) Simulated ABI Band 10 (7.3 micron)
GOES-R and GOES-I/M Simulations of Southern California Fires GOES-12 Simulated 3.9 micron Data Padua/Grand Prix Fires Date: 27-Oct-03 Time: 09:50 UTC GOES-R Simulated 3.9 micron Data Padua/Grand Prix Fires Date: 27-Oct-03 Time: 09:50 UTC BrightnessTemperature (K) Figure courtesy of Elaine Prins 12
Three-color composite (0.64, 1.6 and 11 µm) shows the low cloud over the snow and the water versus ice clouds. Snow Low cloud Figure courtesy of S. Bachmeier
Example: AWG MVFR Probability (Day) The probability of MVFR product reports the probability that the cloud ceiling is < 3000 feet, regardless of surface visibility.
Example: AWG IFR Probability (Day) The probability of IFR product reports the probability that the cloud ceiling is < 1000 feet, regardless of surface visibility.
GOES-R ABI Weighting Functions ABI has 1 CO2 band, so upper-level temperature will be degraded compared to the current sounder
GOES-13 Sounder WFs The GOES-N sounder has 5 CO2 bands, more Shortwave bands than ABI
Satellite-derived winds Satellite-derived winds will be improved with the ABI due to: - higher spatial resolution (better edge detection) - more frequent images (offers different time intervals) - better cloud height detection (with multiple bands) - new bands may allow new wind products - better NEdT’s - better navigation/registration
Example spectral coverage Current GOES Sounder spectral coverage and that possible from an advanced high-spectral sounder. The broad-band nature of the current GOES limits the vertical resolution.
Summary The ABI improves over the current GOES Imager the spectral, temporal, spatial and radiometric performance. The great amount of information from the GOES-R will offer a continuation of current products (precipitation, atmospheric motion vectors, SST, radiances, hurricane intensity, dust, fog, smoke, fires, clouds, etc) and new products (upper-level SO2, vegetation, cloud micro-physics, atmospheric waves, etc). The potential benefits of ABI on the GOES-R series goes beyond the benefits of the current system by more than $4B.