Download
1 / 1
40 likes | 286 Vues
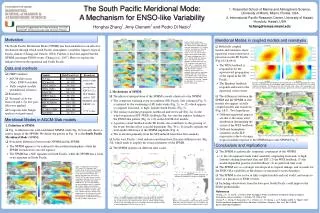
The South Pacific Meridional Mode: A Mechanism for ENSO-like Variability. 1. Rosenstiel School of Marine and Atmospheric Science, University of Miami, Miami, Florida, USA 2. International Pacific Research Center, University of Hawaii, Honolulu, Hawaii, USA hzhang@rsmas.miami.edu.

E N D
The South Pacific Meridional Mode: A Mechanism for ENSO-like Variability 1. Rosenstiel School of Marine and Atmospheric Science, University of Miami, Miami, Florida, USA 2. International Pacific Research Center, University of Hawaii, Honolulu, Hawaii, USA hzhang@rsmas.miami.edu Honghai Zhang1, Amy Clement1 and Pedro Di Nezio2 This work is supported by the Office of Science, U.S. DOE and by NSF Climate and Large-scale Dynamics Program. Meridional Modes in coupled models and reanalysis Motivation Figure 2. Multi-model mean composite of anomalous SST and SLP (left column), cloud radiation and total cloud cover (CLT) (middle column), and latent heat flux and surface wind (right column) at times of -12, -6, 0 and +6 months relative to the peak of SE Pacific SST index (averaged over 25°S–15°S, 110°W–90°W, the thin-blue box). SST and heat fluxes are plotted in shading while SLP and CLT in contours with intervals of 40Pa and 2%, respectively. Solid contours denote positive anomaly and dashed ones negative anomaly. Zero contours are omitted. Latent heat flux and cloud radiation share the same color scale (bottom right). Gray hatched area means the multi-model mean is not significant (see Fig. 1 caption for definition). The heat flux is positive downward. • Both fully coupled models and reanalysis show equatorial warm events have precursors in the SE Pacific (Fig.1d,f & 6b-d). • The WES feedback is responsible for the equatorward propagation of the signal in the SE Pacific. • The Bjerknes feedback responds and leads to the equatorial warm events. The North Pacific Meridional Mode (NPMM) has been identified as an effective mechanism through which north Pacific atmospheric variability impacts tropical Pacific climate (Chiang and Vimont, 2004). Further, it has been argued that the NPMM can trigger ENSO events (Chang et al., 2007). Here we explore the linkages between the equatorial and South Pacific. Data and methods • CMIP3 Archive: • AGCM-slab ocean (50m): ENSO excluded • Fully coupled models (preindustrial scenario) • Reanalysis • Seasonal cycle was removed and 1.5yr low pass filter was applied. • Composite heat budget analysis was performed. • 2. Mechanisms of SPMM: • The physical interpretation of the SPMM is nearly identical to the NPMM. • The composite warming event in southeast (SE) Pacific (left column in Fig. 2) is initiated by the weakening of SE trade winds (Fig. 2c, t=-12) which appears to originate from mid- to high- latitude South Pacific (Fig. 5). • The surface warming propagates northward and westward (Fig. 2a) via the wind-evaporation-SST (WES) feedback (Fig. 6a) onto the equator, leading to the ENSO-like pattern (Fig. 2a, t=6) in the AGCM-slab models. • A positive cloud feedback in the SE Pacific also contributes to the growing of the event, but this effect is model-dependent (Fig. 3b-c). It actually explains the inter-model difference of the SPMM amplitude (Fig. 4). • The event dies primarily from the SST-induced latent heat flux anomaly. • In the west Pacific, cloud radiation and latent heat flux play different roles (Fig. 3d), which tends to amplify the zonal asymmetry of the SPMM. • The SPMM operates on different time scales. • The differences between the SPMM and the NPMM in slab models also appear in fully coupled models and reanalysis (Fig. 1&7). Two hypotheses: • Different equatorial impacts are due to the mean wind distribution determining the extent of the WES feedback. • Different hemispheric symmetry in the SLP regression is due tostronger Meridional Modes in AGCM-Slab models • 1. Definition of SPMM: • Fig. 1a illustrates the well-established NPMM, while Fig. 1b basically shows a mirror image of the NPMM. We define the pattern in Fig. 1b as the South Pacific Meridional Mode (SPMM). • Noticeable differences between the NPMM and the SPMM: • The NPMM appears to be confined to the northern hemisphere, while the SPMM extends more onto the equator. • The SPMM has a SLP signature in North Pacific, while the NPMM has a weak or no signature in South Pacific. tropical rainfall response to the SPMM than to the NPMM (Fig. 7) Conclusions and implications • The SPMM is a physically symmetric counterpart of the NPMM. • (1) the off-equatorial trade wind variability originating from mid- to high- latitudes altering latent heat flux and SST; (2) the WES feedback; (3) the model-dependent positive cloud feedback; (4) no preferred time scale • The SPMM acts as a stronger extratropical-to-tropical linkage, and accounts for the ENSO-like variability in the absence of interactive ocean dynamics. • The SPMM is also active in fully coupled models and real world, and seems to serve as a precursor of ENSO events. • Including observations from the data-poor South Pacific could improve the ENSO predictability. Figure 1. Regression of anomalous SST (color), SLP (contours) and surface winds (arrows) onto normalized SST time series averaged in Northeast (21°N–25°N, 138°W–142°W) (left column) and Southeast (19°S–15°S, 103°W–107°W) (right column) Pacific, respectively. Top row (a, b) is the multi-model mean of AGCM-slab models, middle one (c, d) is for fully coupled version and bottom one (e, f) indicates observation. Negative SLP contours are dashed and positive contours solid with zero SLP contours in heavy solid lines. Contour interval is 10Pa/K. Gray hatched area in (a)-(d) means the multi-model mean is not significant, where the significance is defined when at least 8 out of 11 models agree in sign. Figure 6. Composite Hovmoller diagrams along a tilted path in SE Pacific (dash-blue line in Fig. 2a,t=6) in (a) AGCM-slab, (b) fully coupled models, and reanalysis (c) NOAA ERSST v3, and (d) HadISST, respectively. The reanalysis only after 1979 was used. Color is SST and contours are SLP anomaly. Hatched area in the top row denotes significance (see Fig. 1 caption for definition). Figure 4. Cloud feedback VS SPMM amplitude: the stronger the feedback, the larger the amplitude References Chiang, J. C. H., and D. J. Vimont, 2004: Analogous Pacific and Atlantic meridional modes of tropical atmosphere–ocean variability. J. Climate, 17, 4143–4158. Chang, P., L. Zhang, R. Saravanan, D. J. Vimont, J. C. H. Chiang, L. Ji, H. Seidel, and M. K. Tippett, 2007: Pacific meridional mode and El Nino–Southern Oscillation. Geophys. Res. Lett., 34, L16608, doi:10.1029/2007GL030302. Figure 3. Averaged composite heat budget in (a) multi-model, (b) HadGEM1, (c) CCCmaT63 over EESSP (20°S–10°N, 120°W–80°W, thick-blue box in Fig. 2a,t=0) and (d) multi-model over WCP (10°S–0°, 160°E–160°W, red box in Fig. 2a,t=0). Two models (b & c) are included to show the spread simulation of cloud feedback over EESSP (also see Fig. 4). Figure 5. The anomalous cyclone track (gray line with black dots) and SLP (contours) at t=-18. Numbers are time (months) relative to the composite index in Fig. 2. Figure 7. The same as Fig. 1 but for precipitation (color) and SLP (contours).