9.1 – Inverse Variation
9.1 – Inverse Variation. VARIATION – Direct . Direct Variation is… A relation or function that can be represented by y =kx where k is a constant. For example: This is a direct variation because the model can be represented by y = 3x. VARIATION – Direct .

9.1 – Inverse Variation
E N D
Presentation Transcript
VARIATION – Direct Direct Variation is… A relation or function that can be represented by y =kx where k is a constant. For example: This is a direct variation because the model can be represented by y = 3x
VARIATION – Direct EX – Y varies directly with X. Y = 100 when x =5. Find k. Then find x when y = 150
VARIATION – Direct EX – Y varies directly with X. Y = 100 when x =5. Find k. Then find x when y = 150
INVERSE VARIATION Inverse Variation is… A relation or function that can be represented by xy = k where k is a constant; or – y = k/x For example: This is an inverse variation because the model can be represented by y = 15/x
INVERSE VARIATION EX – Y varies inversely with X. Y = 30 when x =4. Find k. Then find x when y = 150
INVERSE VARIATION EX – Y varies inversely with X. Y = 30 when x =4. Find k. Then find x when y = 150
Identifying Direct and Inverse Variation Ask: What is going on? y increases as x increases. Since y is three times as big as x each time, this is direct variation; y = 3x Ask: What is going on? y increases as x decreases. However, when you multiply x by y you get different values: Since there is no clear relationship, we say that there is no variation!
Ask: What is going on? y increases as x decreases. Test: is it an inverse variation? What is k? We have inverse variation. Therefore, the equation is y = 0.72 x
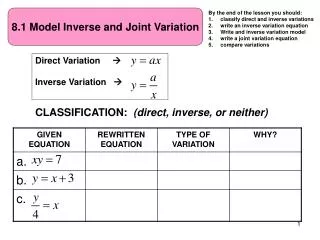
Joint variation Joint variation is variation with more than 2 variables (more than x and y) EX - - y varies directly with x and inversely with z. This would be y= kx z This is the Inverse Variation Part This is the Direct Variation Part
Joint variation EX – Y varies directly with x and inversely with z. Y = 100 when x = 5 and z = 4. Find k. Then find x when y = 200 and z = 10
Joint variation EX – Y varies directly with x and inversely with z. Y = 100 when x = 5 and z = 4. Find k. Then find x when y = 200 and z = 10
More examples: translate the following: Y varies directly with the square of x Y varies inversely with the cube of x Z varies jointly with x and y Z varies jointly with x and y and inversely with w Z varies directly with x and inversely with the product of w and y
Application Application – heart rates and life spans of mammals are inversely related. Let h = heart rate (bpm) and s = life span (min). The constant, k, is 1,000,000,000. That means that hs=1,000,000,000 Let’s find out your heart rate
Application: Working in groups, find the approximate lifespan of each mammal Reminder: heart rates and life spans of mammals are inversely related and k = 1,000,000,000
Graphing Inverse Variation y = k x Graphs of inverse functions will look something like the cross between a linear graph and a parabolic curve. In this case, we are just looking at the graph in the first quadrant. When we look at a true inverse variation function, there will always be two graphs to the functions, diagonal from each other. We will look more at these graphs later on in this chapter.
Graphing Inverse Functions with a Graphing Calculator 1. Press MODE. Scroll down and highlight the word DOT.
Graphing Inverse Functions with a Graphing Calculator Let’s try 2. Press Y= and enter the function 12/x.
Graphing Inverse Functions with a Graphing Calculator 3. Graph the function. Practice: Graph