Introduction to Standard Reports
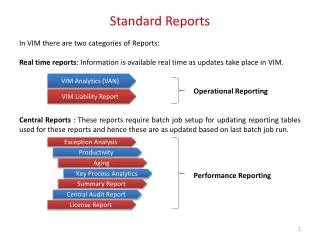
Introduction to Standard Reports. How to get information out of AQS. Standard Reports Site / Monitor Metadata Detail Data Reports “ Raw” Data Extraction Reports Summary Data Audit / Precision & Accuracy Data Raw Data Qualifier Data Certification Design Value

Introduction to Standard Reports
E N D
Presentation Transcript
How to get information out of AQS • Standard Reports • Site / Monitor Metadata • Detail Data Reports • “Raw” Data • Extraction Reports • Summary Data • Audit / Precision & Accuracy Data • Raw Data Qualifier • Data Certification • Design Value • Custom queries via Discoverer Standard Reports
Site & Monitor Reports • Site metadata • Location, nearby streets • Open Path Set Up • Which PM2.5, lead or NO2 Monitor is the Primary Monitor • Monitor metadata • How a given pollutant is measured • Sampling length • Monitoring frequency • Agencies responsible for the monitor and analysis • Monitoring objectives • Collocation information AMP390 – Site Description AMP390 – Monitor Description Standard Reports
Detail Data Reports • “Raw” data from AQS • Can import information into spreadsheet for further processing • Open Path Set Up • Extraction Reports • Provide data in AQS transaction format with Insert, Delete or Update codes • Useful for duplicating and reloading data AMP500 - Extract Site/Monitor Data AMP501 - Extract Raw Data AMP502 - Extract Precision and Accuracy Data AMP503 - Extract Blanks Data Standard Reports
Summary Data Reports • Contains the calculated summary values from AQS • Multi-hour Averages (e.g. 8-hour running average) • Daily Summaries • Site Summaries (PM2.5 and Lead Only) • Quarterly Summaries • Annual Summaries • Site Annual Summaries (PM2.5 and Lead Only) AMP450 – QuickLook AMP435 – Daily Summary AMP355 – Combined Site Sample Values (only for NO2, PM2.5 and lead) Standard Reports
Audit Reports • Audit Data (Precision and Bias data) • 1-Point Quality Control • Annual Performance Evaluations • Flow Rate Verifications • Semi-Annual Flow Rate Audits • Collocation information • Performance Evaluation Program (PEP) • Single and collocated monitor precision checks AMP255 - Data Quality Indicator AMP250 - P/A Raw Data Report AMP246 - Precision Report Standard Reports
Raw Data Qualifier report • Raw data points that have qualifiers • Null data code qualifiers • Quality assurance qualifiers • Exceptional event qualifiers • Includes any Regional Office concurrence information AMP360 - Raw Data Qualifier Report Standard Reports
Data Certification Reports • AMP450 - Quick Look Criteria for CO, NO2, SO2, ozone, PM10, PM2.5, and lead (12128) choose “Include Events” • AMP450NC - Quick Look All for all other pollutants & lead (14129) • AMP255 - Data Quality Indicator Standard Reports
Design Values Report • Generates the statistics used for NAAQS determinations. • Also allows the 1) assessment of the effect of exceptional event flagging on Design Values, and 2) the assessment of attainment issues based on partial data. AMP480 - Design Values Report Standard Reports
Standard Reports • Retrieval • Standard report selection Standard Reports
The Process of Creating a Report – Choosing the “Criteria Set” • Select report (Report Code field) • Specify Output type (Report, Workfile, XML) • Establish report-selection criteria • Geography • Pollutants • Date • Screening group • Modify report Sort Order criteria (where available) • Modify output Report Options (where available) • Generate Report • As you leave Reports form, prompted to save the Criteria Set. Standard Reports
General Issues • Do NOT run reports without specifying some limiting selection criteria • Almost all reports require date-selection criteria • Sort Order and Report Options available on reports where data structure allows • Oracle provides output in several formats. PDF generally most reliable. • Do not use the initial browser window (that started AQS) for any other purpose. If not blank gray, reports will not run properly. • Batch vs online delivery • Online: Pop-up window in web browser window, save from browser window • Batch/CDX: Separate CDX transfer of report to local disk • Batch/email: Email delivery of report as Link Standard Reports
Standard Reports: Criteria Set Standard Reports
Overview of “and/or” in selections • AND within a row • State and county AND site AND parameter AND method AND duration… • OR between rows in block • State/County OR State/County or… • AND between blocks • State AND Pollutant AND date… Standard Reports
Example 1: and/or in Selections • All monitors in Iowa reported by University Hygienic Laboratory during January ’98 • State 19 AND reporting agency 1080 AND all pollutants AND (>19980101 AND <19980131) Standard Reports
Example 2: and/or in Selections (cont.) • All criteria monitors in New York or New England during January ’98 • (State 36 OR region 01) AND (only criteria pollutants) AND (>19980101 AND <19980131) Standard Reports
Example 3: and/or in Selections (cont.) • Ozone or sulfur dioxide monitors in New York and Region 1 during January ’98 • (State 36 AND region 01) AND (44201 OR 42401) AND (>19980101 AND <19980131) • This is a Null dataset, “No Data found” Standard Reports
Standard Reports: Sort Order • Sort order Tab Standard Reports
Report options to consider • Applicable standard • Depends on the pollutant(s) you choose • Exceptional events – on summary reports, show summary data with EDT ID • 0 • 0 – No data has been flagged OR • 1, 2, and 5 • 1 – The summary excludes all flagged data • 2 – The summary does not exclude any data • 5 – The summary excludes regionally concurred flagged data Standard Reports
Standard Reports: Report Options Defaults are shown; Where applicable, the drop-down offers other standards Standard Reports
Standard Reports: Progress Popup • Progress popup buttons apply to the POPUP, not to the report. Standard Reports
Standard Reports: Retrieve Reports • Retrieve Reports Standard Reports
Standard Reports: Report Output Formats • pdf is default Standard Reports
4 2 1 3 Saving a Criteria Set • Saves the Query… Not the Results of the Query • Go to the “Criteria Set” Tab • Enter a Name • Enter a Description • Mark as • Private” (Just for You) • “Public” (For Anyone) • Save / Commit Standard Reports
Put it into practice - Exercise 1.4 Standard Reports
Quicklook 98th percentile completeness for PM2.5 24-hour (2006) standard. Summary criteria met when all 4 site-level quarterly summaries are present, and one of the following is true: quarters are 75% complete, or Annual 98th percentile value greater than the 24-hour standard (35 ug/m3). “WtdArith Mean” for PM2.5 24-annual (2006) standard is based on quarterly means. Summary criteria are met when the percent of observations (quarterly) are >= 75%. (See AQS Data Dictionary section 4.281 and 40 CFR Part 50.13.). Standard Reports
Quicklook “Comp qtrs” are complete quarters. The number of quarterly summaries, with corresponding pollutant standard and exceptional data type, where the summary criterion is met. For NO2, to have a complete quarter, the number of valid days in a quarter compared to number of total days in a quarter must be >= 75%. “Arith Mean” is arithmetic mean. For NO2, this is the average of the hourly values for the year. This is defined on pages 4-20 and 4-21 of the AQS Data Dictionary. The "Summary Criteria" column indicates whether or not the annual summary is complete as required by 40 CFR Part 50. i.e. If the mean is valid by these rules, it is set to 'Y', and if it is not, it is set to 'N‘. For the NO2 annual standard, 75% of the hours for the year must have values. (See AQS Data Dictionary section 4.278 and 40 CFR Part 50.11.) Standard Reports
Quicklook Standard Reports
Maximum Values Multiple lines are due to multiple event types. Check your report criteria. Standard Reports
Design Values – available for PM10, PM2.5, SO2, NO2, ozone Each design value is for a 3-year period. Standard Reports