Download

1 / 35
350 likes | 545 Vues
NOAA Earth System Research Laboratory. Blocking and the MJO in GEFS reforecasts: forecast skill and interactions. Tom Hamill NOAA Earth System Research Lab Physical Sciences Division (303) 497-3060 tom.hamill@noaa.gov.

E N D
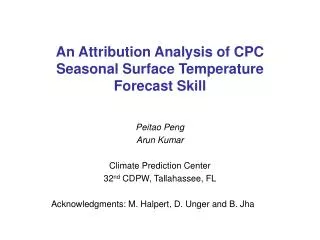
NOAA Earth System Research Laboratory Blocking and the MJO in GEFS reforecasts:forecast skill and interactions Tom Hamill NOAA Earth System Research Lab Physical Sciences Division (303) 497-3060 tom.hamill@noaa.gov presentation to 37th Climate Diagnostics and Prediction Workshop, Ft. Collins, CO, October 2012
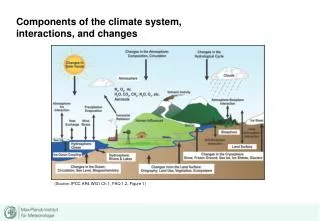
Dec-Jan-Feb 1985-2010 CFSR data. Blocks defined here by Tibaldi/Molteni algorithm.
Questions • How well are blocking and MJO predicted in GEFS? • Is blocking frequency and skill related to MJO, ENSO? • Does GEFS predict interactions of blocking with MJO and ENSO well? (Interactions between these somewhat uncommon phenomena easier to diagnose if one has a large reforecast data set)
Data sets and methods • GEFS Reforecast • Every day from 1985-present (through 2010 here). • 11 members, 1x daily (00 UTC). Forecasts to +16 days. • CFSR (prior to 2011), operational GSI (since 2011) + ensemble transform with rescaling (ETR) cycled initial conditions. • Model: 2012 GEFS configuration; T254L24 in week 1 (~40 km at 40°N), T190L24 in week 2. • Reforecast archive and documentation (incl. BAMS submitted article) at http://esrl.noaa.gov/psd/forecasts/reforecast2/ • MJO: RMM1 and RMM2 defined from CFSR reanalysis U850, U200, and OLR following standard Wheeler & Hendon algorithm.
v2 v1 CFSR initial conditions used in GEFS generally improve over the decades, leading toslight improvements in GEFS skill. (2) About a +2 day improvement relative to 1998 GEFS T62 reforecasts.
MJO, analyzed and deterministic forecast, W. Indian Ocean Let’s examine a subset of cases that start off with initial conditions that have large negative RMM1 and 2, i.e., they suggest a relatively strong MJO emerging from African continent. We have lots of cases of this afforded by multi-decadal reforecasts. It appears that GEFS is too regular with the amplitude of its RMM1/RMM2 forecasts, while the analyzed evolution of amplitude is more scattered.
MJO, analyzed and deterministic forecast, E. Indian Ocean Again, it appears that GEFS is too regular with its RMM1/RMM2 amplitude forecasts.
Find the initial-condition samples with analyzed magnitudes between 1.95 and 2.05 and RMM1 < 0, RMM2 < 0. Then follow analyzed and forecast magnitude evolution and plot pdf. analyzed mean forecast mean A bit more spreading out of the analyzed magnitudes relative to the forecast magnitudes in the first few days of the forecast. Also, amplitude of forecast decreases more.
Find the initial-condition samples with analyzed magnitudes between 1.95 and 2.05 and RMM1 < 0, RMM2 < 0. Then follow analyzed and forecast change in MJO phase per day. analyzed mean forecast mean Observed MJO propagates in phase more regularly than forecast MJO, especially at longer forecast lead times. Observed MJO retains ~ 7 degrees/day phase change. Forecast phase changes decrease to near zero with increasing lead time.
Rank histograms, RMM1 and RMM2 composited GEFS forecasts quickly develop insufficient spread and/or biased mean. Most under-spread and/or biased at the medium range.
MJO deterministic verification metrics from Lin et al., Nov 2008 MWR.
Bi-variate RMM1 and RMM2correlation and RMSE Low amplitude: √(RMM12+RMM22) < 1 High amplitude: √(RMM12+RMM22) ≥ 1
Bi-variate RMM1 and RMM2correlation and RMSE by half decade The first 10 years are much less skillful than the subsequent 16.
Comparing against MJO task force data… Nov 2008-Dec 2010 data GEFS reforecast c/o Jon Gottschalk
Probabilistic forecast verification: CRPSS Method for computing CRPSS discussed in supplementary slides. Reference is climatology. A tougher reference like lagged persistence (slides 7-8) would show the forecasts have a much quicker loss of skill.
N Hem. blocking: more common in winter, spring Blocking as defined in Tibaldi and Molteni (1990) using Z500. Hereafter, let’s focus on Dec-Jan-Feb. Grey bands defines Euro/Atlantic and Pacific blocking sectors in subsequent plots.
NH blockingskill in GEFS reforecasts Pacific BSS (Brier skill score) as defined in supplementary slides. Perfect model uses one member of ensemble as surrogate for analyzed. Real model: skill in blocking to ~12 days Perfect model: ~ 3-4 days longer skill. Onset: date when there are more than 10 subsequent days where at least 20 degrees of longitude in a sector are blocked. Cessation: date of end of that period. Statistics include onset and previous 3 days, cessation and previous 3 days. Atlantic
GEFS blocking skill by half decade Decreased Atlantic sector skill in 1985-1989 period stands out.
My method of quantifying MJO phase In subsequent plots you’ll see I refer to the phase of MJO by its angle from x axis, a θ in conventional polar coordinates. When examining statistics for θ=θ0 , I use RMM 1/2 samples with associated θ0 +/- 22.5 degrees. Example below for θ0=-90 uses samples in blue cone. A “strong” MJO is in the top 25% of RMM 1/2 amplitudes within the cone. θ=+45 θ=0 θ=-45 θ=-135 θ=-90
Change in blocking frequency under strong Indian Ocean MJO Shaded areas are confidence 5/95% confidence intervals. Suppression of blocking frequency in the east Pacific and Atlantic under strong MJO. Day +6 GEFS nicely replicates this suppression.
How does (observed) blocking frequency change according to the lag time of the MJO? Top panel is unconditional DJF blocking frequency, for reference. Bottom panel is difference in strong MJO blocking frequency from unconditional DJF average as a function of latitude and time lag of MJO data relative to blocking data. Blue = less blocks. Here, θ= -90, i.e., ~ Indian Ocean MJO. Here, n-day negative lag means the MJO data was preceding the blocking calculation by n days. Again, note strong suppression of blocking in Pacific both prior to and subsequent to strong Indian Ocean MJO. Very strong suppression of Atlantic block subsequent to Indian Ocean MJO. data from previous 2 slides
How does (observed) blocking frequency change according to the lag time of the MJO? What the heck is happening here? 3-10 days prior to active MJOs in the Indian Ocean, there is a strong suppression of blocking in the Pacific, apparently.
Observed and forecast blocking frequency change according to the lag time of the MJO
Observed and forecast blocking frequency change according to the lag time of the MJO forecast frequency of Pacific blocks prior to Indian Ocean MJO not suppressed like analyzed.
Flow anomalies associated with suppressed Pacific blocking 5 days prior to active Indian Ocean MJO
Conclusions • MJO: • Forecasts decrease in amplitude, slow down relative to analyzed. • Ensemble forecasts under-dispersed/biased. • Some skill, though, especially for high amplitude MJOs • Blocking: • Some skill, but much less than perfect model. • Reasonable replication of blocking climatological frequencies in forecasts. • Blocking and MJO • Blocking frequency decreased under active Indian-Ocean MJO • Acknowledgments: George Kiladis, Steve Colucci, Klaus Weickmann, Jeff Whitaker.
Define BSS for evaluating blocking skill • The blocking Brier Skill score is calculated after summing forecast and climatological Brier scores over the relevant longitudes in either the Pacific or Atlantic basins, respectively, then averaged. For example (Pac):
Computing the CRPSS of GEFS RMM1 and RMM2 forecasts • CRPSS = 1 – CRPS(forecast) / CRPS(climatology) • Φ(.) estimated from normal distribution fit to sample mean and standard deviation.
Blocking computation method:follows Tibaldi and Molteni, 1990 Tellus There are alternatives, such as PV-based index by Pelly and Hoskins. While these may have some advantages, this old standard used hereafter.