Determination of Concentration Using Spectrophotometry
171 likes | 463 Vues
Determination of Concentration Using Spectrophotometry. Lab 8. Outline. Purpose Qualitative Distinction Spectrophotometry Beer’s Law Calibration Curve Procedure Points of Interest Waste Important - printouts Next Lab Reminder. Purpose.

Determination of Concentration Using Spectrophotometry
E N D
Presentation Transcript
Determination of Concentration Using Spectrophotometry Lab 8
Outline • Purpose • Qualitative Distinction • Spectrophotometry • Beer’s Law • Calibration Curve • Procedure • Points of Interest • Waste • Important - printouts • Next Lab Reminder
Purpose This experiment demonstrates the linear relationship between the absorbance and the concentration of a colored solution. Beer’s Law will be used to determine the concentration of a sample for which the concentration is unknown. A relationship can be observed between color intensity and the concentration of a solution.
Qualitative Distinction • Chemical solutions owe their color to light-absorbing species in the solution, whether these are ions or complex molecules. For example: • The blue color of today’s solution could be due to Cu2+ (it is in fact food coloring, not Cu2+). • The color of cranberry juice is due to anthocyanins.
Qualitative Distinction • The color we see is the color of light transmitted, or “getting through” the solution. We see the color of light “left over” after some wavelengths have been absorbed. • Today we will see blue because the solution absorbs orange wavelengths and what’s left over appears blue.
Qualitative Distinction • The intensity of the color is proportional to the concentration of the absorbing chemical species. • We can do a qualitative distinction by eye, or • We can do a quantitative measurement by spectrophotometry.
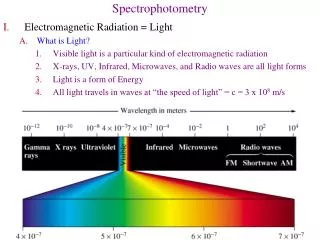
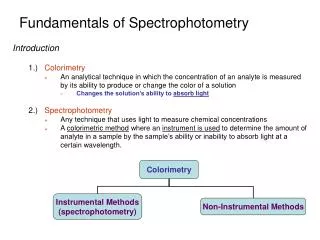
Spectrophotometry • Spectrophotometers shine a light through the sample. • Some detect light from only one wavelength and some detect light from all visible wavelengths. The MicroLAB™ spectrophotometer emits and detects light from sixteen different wavelengths. • The light that is not absorbed by the sample, but transmitted instead, hits a light detector. • The spectrophotometer calculates the percentage of light transmitted. • It then uses an algorithm (formula) to convert percent transmittance to absorbance.
Spectrophotometry Transmitted Light Incident Light I0 I Light Source Wavelength Selector Sample Detector b b = 22.45 mm or 2.245 cm
Spectrophotometry • Transmittance: %T = x 100% • Absorbance: Abs = log
Beer’s Law • Abs = ε b C where Abs = absorbance (no units) ε = molar absorptivity (M-1cm-1) b = path length (cm) C = concentration (M) These measurements all take place at the wavelength at which our absorbing species absorb!
Calibration Curve Plotting Abs vs. [colored solution] gives: This is called a “calibration curve.” For y = m x + b Abs = m [colored solution] + b Abs = ε b c After the calibration curve is established with your standard solutions, the equation is used to calculate the concentration of the unknown solution, given the absorbance of the unknown solution.
Procedure To obtain the calibration curve: • Prepare a series of colored solutions of known concentration (“standards”). • The absorbance of each solution is measured. • Absorbance versus concentration is plotted. • Using the calibration curve equation, the concentration of the unknown solution can be calculated, given the %T or absorbance of the unknown solution: Unk Abs = m [unkcs] + b, therefore, [unkcs] =
Points of Interest • MicroLAB™ colorimeter operation • Your instructor will run through the basics. • Cuvet handling • Wipe down the cuvet with a KimWipe before insertion into the interface.
Safety Concerns – Food Dye • Avoid contact with skin and eyes. • Do not inhale vapor or spray. • Do not ingest.
Waste • All waste solutions can be disposed of down the sink, with plenty of water.
Important: • Before you leave the lab today, print off the following: • Colorimeter calibration curve • Colorimeter spreadsheet • Unknown Abs vs. [ ] graph • Spectrum Profile #1
Lab 9 Reminder • Lab 9 next week.