Download
1 / 25
250 likes | 449 Vues
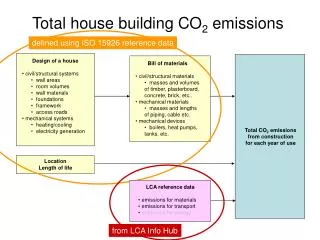
The Power to Reduce CO 2 Emissions The Full Portfolio. Barbara Tyran Director, Washington Relations June 19, 2008 Washington, DC. About EPRI. Founded in 1973 as an independent, nonprofit center for public interest energy and environmental research.

E N D
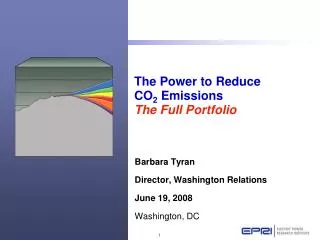
The Power to Reduce CO2 EmissionsThe Full Portfolio Barbara Tyran Director, Washington Relations June 19, 2008 Washington, DC
About EPRI • Founded in 1973 as an independent, nonprofit center for public interest energy and environmental research. • Objective, tax-exempt, collaborative electricity research organization • Science and technology focus--development, integration, demonstration and applications • Broad technology portfolio ranging from near-term solutions to long-term strategic research Together…Shaping the Future of Electricity
Large and Successful R&D Collaboration • More than 450 participants in over 40 countries • Over 90% of North American electricity generated • 66 technical programs • Generation • Power Delivery and Markets • Nuclear • Environment • Technology Innovation • 1600+ R&D projects annually • 10 to 1 average funding leverage • Research is directed to the public benefit • Limited regulatory, judicial and legislative participation
Basic Research & Development Collaborative Technology Development Integration Application Technology Commercialization National Laboratories Universities EPRI Suppliers Vendors EPRI’s Role Depends Upon The Specific Technology or Discipline
Context • Growing scientific and public opinion that CO2 emissions are contributing to climate change… • Priority of 110th Congress … • U.S. responsible for 1/4 of global CO2 emissions… • Electricity sector responsible for 1/3 of U.S. CO2 emissions… • General agreement that technology solutions are needed… How can the electricity industry respond?
Presentation Objective…Answer Three Questions • What is the technical potential for reducing U.S. electric sector CO2 emissions? • What are the economic impacts of different technology strategies for reducing U.S. electric sector CO2 emissions? • What are the key technology challenges for reducing electric sector CO2 emissions?
2008 Prism...Technical Potential for CO2 Reductions AEO2007*(Ref) Achieving all targets is very aggressive, but potentially feasible. AEO2008*(Early release) AEO2008*(Ref) Impact of efficiency measures in Energy Independence and Security Act of 2007 (EISA2007) *Energy Information Administration (EIA) Annual Energy Outlook (AEO)
Presentation Objective…Answer Three Questions • What is the technical potential for reducing U.S. electric sector CO2 emissions? • What are the economic impacts of different technology strategies for reducing U.S. electric sector CO2 emissions? • What are the key technology challenges for reducing electric sector CO2 emissions?
9 Starting Point is Current Intensity Target 8 7 2010 Cap to 2020 6 5 Billion Tons CO2 per year 4 3% decline 3 2 1 0 2000 2010 2020 2030 2040 2050 Assumed U.S. Economy-Wide CO2 Constraint • PRISM electric sector CO2 profile most closely modeled by economy-wide constraint which: • Caps emissions at 2010 levels until 2020 • Requires 3% decline beginning in 2020 • Constraint in 2050 ~50% of 1990 emissions levels
U.S. Electric Generation – Full Portfolio The vast majority of electricity supply is CO2-free Wind Hydro Gas and non-captured coal are the only supply options paying a CO2 cost Nuclear Gas Public Policy (RPS) can modify this economic allocation Coal with CCS Coal
With a less de-carbonized supply, electricity load must decline to meet the CO2 emissions target Gas (with half the CO2 of coal) pays a significant CO2 cost U.S. Electric Generation – Limited Portfolio Biomass Wind Hydro Nuclear Gas Coal
180 4.0 160 3.5 140 3.0 120 2.5 100 2.0 80 1.5 60 1.0 40 0.5 20 0 0.0 2000 2010 2020 2030 2040 2050 Wholesale Electricity Price In the Full Portfolio the price of electricity has a low CO2 cost component and increases less Limited Index Relative to Year 2000 $/MWh* Full Year *Real (inflation-adjusted) 2000$
Increase in Real Electricity Prices…2000 to 2050 +260% +45% Both Scenarios meet the same economy-wide CO2 Cap* *Economy-wide CO2 emissions capped at 2010 levels until 2020 and then reduced at 3%/yr
Full Technology Portfolio Reduces Costs of a CO2 Emissions Reduction Policy by 60% 0.0 Cost of Policy Full Portfolio + PHEV Only Limited Portfolio + CCS Only + Nuclear Only + Renewables Only + Efficiency Only -0.5 Change in GDP Discounted Through 2050 ($Trillions) Reduction in Policy Cost with Advanced Technology $1 Trillion -1.0 -1.5 Value of R&D Investment
Presentation Objective…Answer Three Questions • What is the technical potential for reducing U.S. electric sector CO2 emissions? • What are the economic impacts of different technology strategies for reducing U.S. electric sector CO2 emissions? • What are the key technology challenges for reducing electric sector CO2 emissions?
Transition to Low-Emissions Technologies • Enabling Efficiency, PHEVs, DER via the Smart Distribution Grid • Enabling Intermittent Renewables via Advanced Transmission Grids • Expanded Advanced Light Water Reactor Deployment • Advanced Coal Plants with CO2 Capture and Storage
CCS Global Growth Rate is Quite Rapid in a 550ppm World CO2 Storage Rate 550 ppm Source: MiniCAM, 2006
CCS Growth Could Be a Century-Long Challenge CO2 Storage Rate 550 ppm Source: MiniCAM, 2006
Electricity demand will grow… • EIA 2008 Annual Energy Outlook • Preliminary report projects 1150 TWh (30%) increase in U.S. electricity consumption by 2030. • Greater than addition of new load equivalent to 2006 consumption of Texas, California, Florida, Ohio, Pennsylvania ~13 New York metro areas!
Challenges in End-Use EfficiencyGrowth in Electronic Load • Increase in electricity use by adding a 46” plasma and a set-top box: ~860 kWh/yr/household or 2.7% of US electricity consumption Plasma TV (~300W), Set-top Box (~30W) • Increase in electricity use by adding one digital photo frame per household: ~Five 250MW generation plant Digital photo frame (6W-15W) By 2030 almost 30% of residential load will be “plug connected” (DOE/EIA Annual Energy Outlook 2007)
Growth in Electronic Load PLASMA TV SET TOP BOX 42”250W 30W = vs. 27”100W 30W 2 set top boxes consume as much energy in one year as a refrigerator Consumes 2.5x more energy