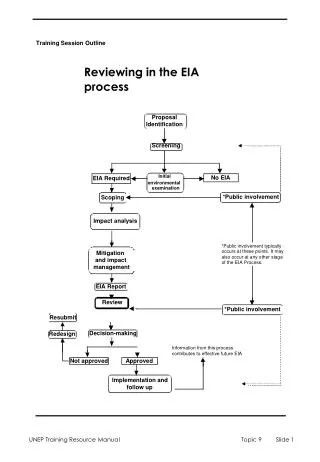
EIA CES Analysis
EIA CES Analysis. First Requested by Ralph HAll (R-TX) And second, by Jeff bingaman (D-NM) Matt Cox. Eligible Technologies. Hall. Bingaman. Hydro Wind Solar Geothermal Biomass MSW, LFG Nukes CCS-Coal, CCS-NG 0.9 credits NGCC 0.5 credits.

EIA CES Analysis
E N D
Presentation Transcript
EIA CES Analysis First Requested by Ralph HAll (R-TX) And second, by Jeff bingaman (D-NM) Matt Cox
Eligible Technologies Hall Bingaman • Hydro • Wind • Solar • Geothermal • Biomass • MSW, LFG • Nukes • CCS-Coal, CCS-NG • 0.9 credits • NGCC • 0.5 credits • New hydro and nukes (including capacity additions) • Existing does not receive credit but counts towards overall generation goals • Wind • Solar • Geothermal • Biomass • MSW, LFG • CCS-Coal, Gas, NGCC, IGCC, Gas turbines • Receive partial credit based on carbon intensity
Details of the Standard Hall Bingaman Credit-based system All sectors eligible to generate credits Linear rise from 40% in 2010 (historical) to 80% by 2035 No banking Standard operates independent of State policies Credit-based system All sectors eligible 1% growth from 2015-2020; 2% til 2035; 1% til 2050 to reach 95% by 2050 Banking allowed Standard operates independent of State policies
Results: Decreased Coal, Increased Gas and Renewables (Nukes Mixed) HCES: 56% less coal, 30% more nuke. Wind doubles, little change for solar. BCES: 52% less coal, 53% more gas, 10% less nuke, 121% more wind.
Impacts on Electricity-Related CO2 Emissions and Electricity Prices HCES: Emissions drop 60%; Electricity price increases by 29% BCES: Emissions drop 43%; Electricity price increases by 21%
Impact on GDP/Employment HCES BCES
Final Thoughts • Impacts are roughly similar to carbon tax by 2035 • Path of trajectories varies • Hall sees faster impacts on GDP and higher electricity prices by 2015 • Bingaman sees smaller GDP impacts overall with significant changes in electricity prices not occurring until the early 2020’s