Download
1 / 64
650 likes | 860 Vues
Spatial Localization and Multinuclear MR Spectroscopy Techniques. Navin Bansal, Ph.D. Associate Professor and Director of MR Research. Proton MR Image. MR images contain anatomical information based on the distribution of protons and the relative proton relaxation rates in various tissues

E N D
Spatial Localization and Multinuclear MR Spectroscopy Techniques Navin Bansal, Ph.D. Associate Professor and Director of MR Research
Proton MR Image • MR images contain anatomical information based on the distribution of protons and the relative proton relaxation rates in various tissues • MR images are based on proton signals from water and fat
MR Spectrum • MR spectroscopy determines the presence of certain chemical compounds • Stress, functional disorders, or diseases can cause the metabolite concentration to vary • Metabolite concentrations are low, generating ~10,000 times less signal intensity than the water signal
Chemical Shift • The electron cloud around each nuclei shields the external magnetic field • Because of differences in electron shielding, identical nuclei resonate at different frequencies • The resonance frequency in the presence of shielding is expressed as: • = (1- )Bo Where is the gyromagnetic ratio and Bo is the external magnetic field strength 1H MR spectra -CH3 -OH , ppm 2 1 0
Chemical Shift • The frequency shift increases with field strength. For example, shift difference between water and fat (water - fat) at 1.5 T is 255 Hz at 3.0 T is 510 Hz = (water - fat) 106/Bo, in ppm units water-fat is 3.5 ppm independent of field strength • By convention • Signals of weakly shielded nuclei with higher frequency are on the left • Signals of more heavily shielded nuclei with lower frequency are on the right • Chemical shift of water is set to 4.7 ppm at body temperature
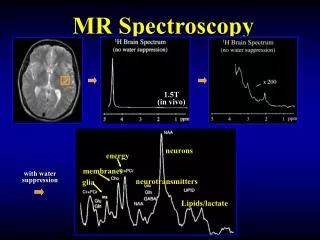
1H MR Spectrum from Brain Water Signal Metabolite Signals
Spatial Localization • Surface Coil Localization • Simple surface coil acquisition • Depth Resolved Surface Coil Spectroscopy, DRESS • Single Volume Localization • Image Selected In Vivo Spectroscopy, ISIS • Point Resolved Spectroscopy, PRESS • Stimulated Echo Acquisition Mode, STEAM • Multiple Volume Acquisition • Chemical Shift Imaging, CSI
Surface Coil Acquisition A simple loop of wire and associated circuit tuned to the desired frequency are placed directly over the tissue of interest to obtain spectra A surface coil • Advantages • Easy to build and does not require specialized pulse sequence • Superb SNR and filling factor Disadvantages • Must be close to region of interest • Changing ROI is difficult • Inhomogeneous RF field RF Pulse-acquire sequence
Spin Echo Imaging Sequence 90° 180° 90° RF G z G y G x TE TR
RF G slice Depth Resolved Surface Coil Spectroscopy, DRESS A disk-shaped slice is excited parallel to the surface coil with a frequency selective RF pulse in the presence of a gradient. • Advantages • Relatively simple • Suppresses signal from superficial tissue • Multi-slice acquisition, SLIT-DRESS Disadvantages • T2 loss • Partial Localization
RF Gx RF Gy RF Gz Single Volume Localization • Localized spectra is obtained from a single volume of interest (VOI) • Localization is achieved by sequential selection of three orthogonal slices • The size and location of VOI can be easily controlled • Anatomic 1H images are used for localizing the VOI
Single Volume Localization • Image selected in vivo spectroscopy, ISIS • Point resolved spectroscopy, PRESS • Stimulated echo acquisition mode, STEAM
Slice inversion No inversion Subtraction G slice Image Selected In Vivo Spectroscopy ISIS One Dimensional 180o 90o RF Two acquisitions with and without inversion of a selected slice are obtained and subtracted
90° + RF 1 180° 90° - RF 2 180° 90° - RF 3 180° 90° - RF 4 180° 180° 90° RF + 5 180° 180° 90° RF + 6 180° 180° 90° RF + 7 180° 180° 180° 90° - RF 8 G x G y G z T1 T1 T1 3D ISIS • A set of eight pulse sequences with one, two, or three slice selective inversion pulses are used • The signal is localized to a VOI by adding signals from sequences 1, 5, 6, and 7 and subtracting signals from 2, 3, 4, and 8.
Image Selected In Vivo Spectroscopy, ISIS • Advantages • No T2 loss – 31P MRS • Less sensitive to gradient imperfections • Can be used with a surface coil Disadvantages • Dynamic range • Subtraction error due to motion
Point Resolved Spectroscopy, PRESS 180° 180° 90° RF G x G y G z TE1/2 (TE1+TE2)/2 TE2/2 • A slice-selective 90o pulse is followed by two slice-selective 180o refocusing pulses • Achieves localization within a single acquisition • Suitable for signals with long T2 – 1H MRS
90° 90° 90° RF G x G y G z TE/2 TM TE/2 Stimulated Echo Acquisition Mode, STEAM • Three slice-selective 90o pulses form a stimulated echo from a single voxel. • Achieves localization within a single acquisition • Only half of the available signal is obtained • Can achieve shorter TE than PRESS
Effects of MR Parameters on PRESS spectra • Repetition Time, TR • Number of Signal Averages • Echo Time, TE • Voxel Size
NAA Cho Cr/PCr Cr/PCr Effect of Repetition Time (TR) TR = 1500 ms TR = 5000 ms
Effect of Signal Averaging 8 Averages 64 Averages 256 Averages
Effect of Voxel Size 1 cc 2 cc 4 cc 8 cc
Effect of Echo Time, TE TE = 144 ms TE = 288 ms
Glx 2.05-2.45 ppm 3.6 - 3.8 ppm mI 3.56 ppm Glucose 3.43 ppm 3.8 ppm And more Short TE 1H Brain Spectrum Healthy volunteer Additional Peaks
The Lactate Doublet Tumor spectra: showing no NAA, Cho, mI, lactate Lipids and lactate Inverted lactate Upright lactate
Single Voxel Spectroscopy: Overview • Simplicity • Flexibility in voxel size and position • Accurate definition of VOI • Excellent shim and spectral resolution • Many voxels within the same dataset
90° RF G slice G y G z Chemical Shift Imaging • Multiple localized spectra are obtained simultaneously from a set of voxels spanning the region of interest • Uses same phase-encoding principles as imaging • No gradient is applied during data collection, so spectral information is preserved
CSI Spectral Map • Display of all spectra • Underlying reference image shows voxel position • Individual spectra can be displayed enlarged • Spectral map can be archived together with the reference image and the CSI grid
CSI Data Analysis Image showing voxel position Spectrum from a voxel
NAA NAA/Cho Spectral Map and Metabolite Images
CSI: Overview Advantages • Acquisition of multiple voxels • Metabolite images, spectral maps, peak information maps, and results table • Many voxels within the same dataset Disadvantages • Large volume – more difficult to shim • Voxel bleeding • Large datasets
Important Nuclei for Biomedical MR 1H – Neurotransmitters, amino acids, membrane constituents 2H – Perfusion, drug metabolism, tissue and cartilage structure. 13C – Glycogen, metabolic rates, substrate preference, drug metabolism, etc. 19F – Drug metabolism, pH, Ca2+ and other metal ion concentration, pO2, temperature, etc 23Na – Transmembrane Na+ gradient, tissue and cartilage structure. 31P – Cellular energetics, membrane constituents, pHi, [Mg2+], kinetics of creatine kinase and ATP hydrolysis.
4.5 3.5 3.0 2.5 2.0 1.5 1.0 0.5 1H MR Spectra of the Brain Short TE NAA Cr Cho Ins Glx Glx Lipids Cr ppm
O CH3-C-NH-CH-CH2-COOH CH2-COOH NH NH2-C-N-CH2-COOH CH3 Important 1H Signals N-Acetyl aspartate (NAA) • NAA is a neuronal marker and indicates density and viability of neurons. • It is decreased in glioma, ischemia and degenerative diseases. 2.02, CH3 2.52, CH2 2.70, CH2 4.40, CH Creatine (Cr), phosphocreatine (PCr) • Cr is a marker of aerobic energy metabolism • Cr signal is constant even with pathologic changes and may be used as a control value • However, isolated cases of Cr deficiency may occur in children 3.04, CH3 3.93, CH2
NH2-CH2-CH2-CH-COOH NH2 HOOC-CH2-CH2-CH-COOH NH2 CH3 CH3-N-CH2-CH2-OH CH3 Important 1H Signals Choline (Cho), choline compounds • Cho compounds are involved in phospholipid metabolism of cell membrane. • Increase Cho mark tumor tissue or multiple sclerosis plaques 3.24, CH3 3.56, CH2 4.07, CH2 Glutamate (Glu), glutamine (Gln) • Glu is a neurotransmitter, Gln a regulator of Glu metabolism • It is hardly possible to detect their signals sepratly. The signals are jointly designated “Glx”. 2.1, CH2 2.4, CH2 3.7, CH
PO4- CH3-CH-COOH PO4- PO4- PO4- OH PO4- PO4- Important 1H Signals Lactate (Lac) • Lactate is the final product of glycolysis • It can be detected in ischemic/hypoxic tissue and tumors indicating lack of oxygen 1.33, CH3 4.12, CH Taurine (Tau) • Cells examination indicates taurine synthesis in astrocytes 3.27, NCH2 3.44, SCH2 NH2-CH2-CH2-S-OH Myo-inositol (Ins) • Ins marks glia cells in brain • It is decreased in hepatic encephalopathy and elevated in Alzheimer’s disease. 3.56, CH
Muscle Heart Liver 10 0 -10 -20 Kidney Brain 31P MR Spectra of Normal Tissue 4 2 3 1 6 -ATP -ATP -ATP PCr PDE Pi PME 4 2 1 3 6 7 5 3 6 2 7 4 1 6 5 3 2 4 1 7 6 5 4 3 2 1 ppm
Important 31P Signals Adenosine triphosphate (ATP) ATP is the energy currency in living systems - and -ATP have contributions from ADP, NAD and NADH -ATP is uncontaminated and used for quantification -16.5 -ATP -7.8 -ATP -2.7 -ATP Phosphocreatine (PCr) PCr is used for storing energy and converting ADP to ATP It is absent in liver, kideny and red cells It is used as an internal reference for chemical shift 0 PCr
Important 31P Signals Inorganic Phosphate (Pi) • Pi is generated from hydrolysis of ATP and increased in compromised tissue • Its chemical shift is sensitive to pH 3.7 to 5.7 Pi Phosphomonoester (PME) • PME signal contains contribution from membrane constituents and glucose-6-phosphate and glycerol-3 phosphate. • It is elevated in tumors 5.6 to 8.1 PME Phosphodiester (PDE) • PME signal contains contribution from membrane constituents 0.6 to 3.7 PDE
Pi ATP PCr PME pk a Shift, ppm 30 20 10 0 -10 -20 Measurement of pH by 31P MRS H2PO4- HPO42- + H+ pKa = 6.75 é ù - - obs H PO ê ú pH = + log 2 4 - ê ú û ë - obs 2 HPO 4
Detection of myocardial infarctions by 31P-MR spectroscopy Beer et al., J Magn Reson Imaging. 2004;20:798-802.
A Lesson from 31P MRS Tumor Microenvironment Poor Vascularization and Perfusion Tumors are expected to be acidic Hypoxia Anaerobic Glycolysis Aerobic Glycolysis Increased Acid Production
pH 5.6 6.0 6.4 6.8 7.2 7.6 ü ý þ pH of Tumors and Normal Tissue Electrode Measurements A: pH POT Skeletal Muscle Normal Brain Tissue Skin Glioblastomas Astrocytomas Meningiomas Brain Metastases Malignant Melanomas Sarcomas Mammary Ca. Adenocarcenomas Squamous Cell Ca.
pH 5.6 6.0 6.4 6.8 7.2 7.6 ü ý þ pH of Tumors and Normal Tissue MRS Measurements B: pH NMR Skeletal Muscle Normal Brain Skin Tissue Heart Sarcomas Squamous Cell Ca. Mammary Ca. Brain Tumors Non-Hodgkin Lymp. Misc Tumors Bansal, et al.
23Na MR Spectroscopy and Imaging