Download
1 / 34
340 likes | 509 Vues
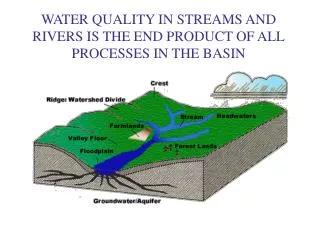
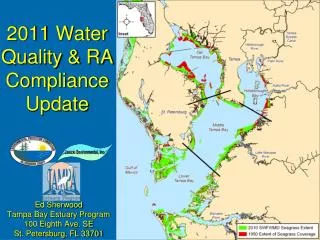
2011 Water Quality & RA Compliance Update. Ed Sherwood Tampa Bay Estuary Program 100 Eighth Ave. SE St. Petersburg, FL 33701. TBEP Nitrogen Management Strategy. Reduce Nitrogen Loads. Reduce Chloro- phyll. Sea- grass Recover. Reduce Light Atten- uation.

E N D
2011 Water Quality & RA Compliance Update Ed Sherwood Tampa Bay Estuary Program 100 Eighth Ave. SE St. Petersburg, FL 33701
TBEP Nitrogen Management Strategy Reduce Nitrogen Loads Reduce Chloro- phyll Sea- grass Recover Reduce Light Atten- uation 1998: NMC Partnership Formed to “Hold the Line” 1996-2009: NMC Projects Preclude >430t N / yr 2010: RA Accepted & Adopted by FDEP, N Load Allocations Voluntarily & Proactively Developed 2011+ : Demonstrating RA Compliance & Providing Input on Criteria Development 2012: RA Update! 2006: First-time All Segments Meet TBEP Management Targets
Adopted Compliance Assessment • NMC Action 1: Report attainment of bay segment specific chlorophyll-a thresholds to FDEP and EPA over the 2007-2011 period. • NMC Action 2: Report anomalous event(s) or data which influenced a chlorophyll-a exceedence over the 2007-2011 period to FDEP & EPA. • NMC Action 3: Consider re-evaluation of bay segment assimilative capacities. • NMC Action 4: Compile loading evaluations & identify potential further actions needed to achieve reasonable assurance for adopted bay segment allocations.
FDEP Recognized Site Specific Thresholds for Chlorophyll-a to Maintain Tampa Bay Reasonable Assurance • Hillsborough Bay: 15.0 ug/L • Old Tampa Bay: 9.3 ug/L • Middle Tampa Bay: 8.5 ug/L • Lower Tampa Bay: 5.1 ug/L
Bay Segment Chlorophyll-a Compliance 2007-2011 – 5 Year RA Compliance Period
Tampa Bay Chl-a (2007-2011) • Significant Pyrodinium blooms occurred in the summer of 2008, 2009 and 2011
2010 Seagrass Estimates • All TB segments showed increased acreage • Upper bay segments still have room to “grow”
Bay Segment Seagrass Targets 8,360 acres 10,545 acres 1,045 acres 8,930 acres 38,000 acres 7,030 acres 1,663 acres 427 acres
Summary of Results • Water quality in Tampa Bay declined in 2011; however, it still appears to support seagrass expansion in the majority of the segments • Seagrass acreage in Tampa Bay continues to increase, next update anticipated at the end of 2012 • Targeted evaluation of appropriate management actions to undertake in Old Tampa Bay is ongoing
OTB Integrated Ecological Model http://www.swfwmd.state.fl.us/projects/old_tampa_bay/ • Initiated Fall 2011 • Model development anticipated in 2012 - mid 2013 • Management action scenario simulations Fall 2013 – Early 2014 • Final Report due June 2014
2009 RA Addendum • Consortium developed and agreed to limits on nitrogen loads for 189 sources in Sept. 2009 • FDEP approved full RA Plan in December 2010 • Annual compliance assessments
Management Framework • Bay segment annual average values compared to established bay segment targets for chlorophyll-a and light attenuation • Results of each comparison placed into decision matrix framework • Overall management response determined for each bay segment
2011 Results *Small magnitude exceedence **Large magnitude exceedence
TBEP Nitrogen Management Strategy Reduce Nitrogen Loads Reduce Chloro- phyll Sea- grass Recover Reduce Light Atten- uation
Observed Seagrass Gains & Losses 2001-2004 2004-2006
Observed Seagrass Gains & Losses 2006-2008 2008-2010