Download
1 / 41
410 likes | 589 Vues
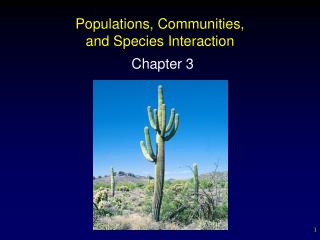
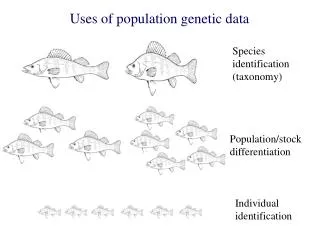
Uses of population genetic data. Species identification (taxonomy). Population/stock differentiation. Individual identification. Genetics questions relevant to conservation biology: are x and y different species? are populations genetically different?

E N D
Uses of population genetic data Species identification (taxonomy) Population/stock differentiation Individual identification
Genetics questions relevant to conservation biology: are x and y different species? are populations genetically different? how much variation is present in a population? how much variation has been lost? which parents contributed to the breeding population? how much migration is occurring between populations?
A T T A G C G C C G T A A T A T DNA sequence DNA strand chromosome protein organism
morphometric and meristic counts ~ 40 characters Often lethal
Morphometrics (measurements) 6-7 pelvic fin rays meristics (counts)
Issues with morphometric and meristic data • Are they different enough? • What is the significance of the differences? • (do they represent genetic differences?) • Do the differences indicate reproductive isolation?
LEVELS OF VARIATION morphometric and meristic counts ~ 40 characters Often lethal protein loci ~ 200 loci Often lethal
Protein electrophoresis Basis: • alleles result from changes in base pairs in DNA code • base pair change results in different amino acid in protein • resulting proteins may vary in size, shape, net electric charge + + + + + + + + + +
Protein electrophoresis Basis: • electrophoresis separates proteins on the basis of their net electric charge, and size/shape • thus, alleles coding for proteins with different size or charge will be detected as different • genotype is deduced from protein types • co-dominant, low variability
Protein electrophoresis alleles Population 1 + a’ a _ 1 2 3 4 5 6 7 8 9 10 INDIVIDUALS
Protein electrophoresis alleles Population 1 a’’ a’ a Population 2 a’’ a’ a Population 3 a’’ a’ a 1 2 3 4 5 6 7 8 9 10 INDIVIDUALS
monomeric protein dimeric protein
LEVELS OF VARIATION morphometric and meristic counts ~ 40 characters Often lethal protein loci ~ 200 loci Often lethal chromosome 100s of characters May be lethal
Cytogenetics – information from chromosome number, shape, banding patterns
LEVELS OF VARIATION morphometric and meristic counts ~ 40 characters Often lethal protein loci ~ 200 loci Often lethal chromosome 100s of characters May be lethal DNA strand 100s to 1,000s of characters Non-lethal
Mitochondrial circular small - 16,000-20,000 bp many copies maternal inheritance moderate variation mostly coded loci Nuclear linear 3 billion + base pairs two copies per cell bi-parental inheritance high variation much non-coded DNA DNA
‘Problems’ with DNA • not very much of it (2-100 copies per cell)- need to ‘amplify’ it • too much of it (3 billion base pairs)- need to look at small pieces at a time • different areas of DNA have different variation
Amplification of DNA PCR - polymerase chain reaction: • split DNA strand into two strands • bind primers on either side of segment to be amplified • allow new matching DNA strands to assemble on each side • repeat as often as needed
Polymerase Chain Reaction (PCR) - DNA replication in a test tube Requires ingredients: DNA template DNA polymerase free nucleotide bases DNA template must be separated (denatured, unwound) must be a primer for DNA polymerase to add free nucleotides to
Polymerase Chain Reaction (PCR) each replication cycle doubles amount of DNA
Polymerase Chain Reaction (PCR) Requires ingredients: DNA template DNA polymerase free nucleotide bases DNA template must be separated (denatured, unwound) heat will denature DNA, but deactivates protein enzymes use Taq DNA polymerase (from bacterium Thermus aquaticus from thermal vents)
Polymerase Chain Reaction (PCR) Requires ingredients: DNA template DNA polymerase free nucleotide bases DNA template must be separated (denatured, unwound) must be a primer for DNA polymerase to add free nucleotides to short sequence of DNA that binds ‘upstream’ of area to be replicated
DNA analyses • mtDNA (mitochondrial DNA analysis) • RFLP (restriction fragment length polymorphism) • RAPD (randomly amplified polymorphic DNA) • AFLP (amplified fragment length polymorphism) • microsatellites (SSR, simple sequence repeats) • single nucleotide polymorphisms (SNPs)
Restriction Fragment Length Polymorphism (RFLP) - cut DNA with restriction enzymes - isolate cut fragments based on length (electrophoresis) - deduce length of fragments - individuals differ based on mutations at restriction sites A T T G A C T T A A G C G T A G T A A C T G A A T T C G C A T C cleavage site (palindrome)
Restriction enzyme cleavage of mitochondrial DNA Mitochondrial DNA DNA fragments gel
A T T G A C T T A A G C G T A G T A A C T G A A T T C G C A T C Single base pair substitution removes cleavage site recognition A T T G A C T C A A G C G T A G T A A C T G A G T T C G C A T C
Microsatellite DNA • tandem repeats of short DNA sequences (e.g. ACACACACAC…) • number of repeats is highly variable – easy cross-over ‘mistake” • co-dominant
Microsatellite DNA • tandem repeats of short DNA sequences (e.g. ACACACACAC…) • number of repeats is highly variable – easy cross-over ‘mistake” • co-dominant • isolate portions of DNA with primers (time-consuming to develop) • separate fragments by length ~ number of repeats
SNPs (single nucleotide polymorphisms) • DNA sequencing • Genome sequencing • Barcode of Life Database (BOLD)
LEVELS OF VARIATION A T T A G C G C C G T A A T A T morphometric and meristic counts ~ 40 characters Often lethal protein loci ~ 200 loci May be lethal chromosome 100s of characters May be lethal DNA strand 100s to 1,000s of characters Non-lethal DNA sequence millions… Non-lethal whole frozen live preserved or dried organism tissue tissue tissue
Step 1: find markers ‘survey’ species/population for polymorphisms before conducting full study = # of loci, # alleles/locus Step 1(b): find/develop primers for PCR often available on web databases from related taxa Step 2: determine how many markers are needed depends on question(s) of interest
Smelt isozymes, Lake Champlain MDH-1 MPI Main lake Mallets Bay Inland Sea
Comparison of Eurasian and N. American yellow perch XDH-1 LDH-1 Perca flavescens Perca fluviatilis
Cheetah (Acinonyx jubatus): O’Brien et al. 1983. The cheetah is depauperate in genetic variation - using protein electrophoresis - assumed to be result of small N, bottleneck, then inbreeding - highly vulnerable to disease outbreaks (50% mortality in one captive population)
Cheetah (Acinonyx jubatus): O’Brien et al. 1983. The cheetah is depauperate in genetic variation - using protein electrophoresis # # % poly. av. Species popns. N loci loci H Drosophila 43 >100 24 43.1 0.14 Mus 2 87 46 20.5 0.088 Homo sapiens many >100 104 31.7 0.063 Felis catus 1 56 55 22 0.076 Cheetah 2 55 47 0.0 0.0
Cheetah (Acinonyx jubatus): Menotti-Raymond and O’Brien et al. 1993. - using protein electrophoresis, high-resolution PE, and mtDNA # # % poly. av. Species popns. N loci loci H Drosophila 43 >100 24 43.1 0.14 Mus 2 87 46 20.5 0.088 Homo sapiens many >100 104 31.7 0.063 Felis catus 1 56 55 22 0.076 Cheetah 2 55 47 0.0 0.0 Drosophila 1 20 54 11.1 0.04 Mus 1 72 4.1 0.02 Homo sapiens 1 34 many 1.2 0.063 Cheetah 1 6 155 3.2 0.013 Felis catus 1 17 46.0 Cheetah 3 76 45.0
Merola, 1994. A reassessment of homozygosity …. - carnivores tend to show low levels of genetic variation (several have lower levels of H and P than cheetah) - measures of fluctuating asymmetry indicate cheetah is not suffering from low homozygosity or genetic stress - sperm deformities – do not affect fertility, may be normal in felids - low litter sizes – in captivity (high in wild) - susceptibility to disease – may be due to captive contact (in wild, cheetahs avoid conspecifics) Concluded that conservation is better directed at habitat
Spotted owls vs. barred owls (Haig et al. 2004, Cons. Biol. 18:1347-1357) Northern spotted owl – endangered Barred owl – rapid range expansion has led to overlap with spotted owl - potential competition - potential for hybridization mtDNA and AFLP analysis: - species are distinct - no evidence of previous gene flow - hybrids occur with male spotted and female barred owls - hybrids can be identified until F2 generation
e-DNA (environmental DNA) as a method for detection of rare/elusive species