
Uploaded by
awena
26 SLIDES
363 VUES
260LIKES
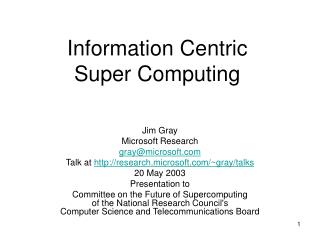
Super Computing in Excel for Data Visualization
DESCRIPTION
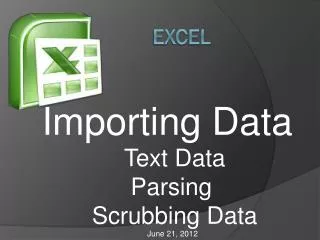
Learn how to optimize your data analysis using Excel! This tutorial by Jery Esquivel covers spreadsheet programs, data management, graph insertion, and advanced features like scatter plots. Discover tips for trend analysis, labeling, and saving your data efficiently in CSV format. Enhance your skills today!
Download

1 / 26
Télécharger la présentation 
Super Computing in Excel for Data Visualization
An Image/Link below is provided (as is) to download presentation
Download Policy: Content on the Website is provided to you AS IS for your information and personal use and may not be sold / licensed / shared on other websites without getting consent from its author.
Content is provided to you AS IS for your information and personal use only.
Download presentation by click this link.
While downloading, if for some reason you are not able to download a presentation, the publisher may have deleted the file from their server.
During download, if you can't get a presentation, the file might be deleted by the publisher.
E N D


More Related