Download
1 / 22
220 likes | 352 Vues
Year-end Report January –December 2004 Leif Östling President and CEO. Key figures Full year 2004. Order bookings 59,981 vehicles +23% Deliveries 56,082 vehicles +12% Revenue SEK 56,788 m. +12% Operating margin 11.2% (10.1%) Net income SEK 4,077 m. +34%

E N D
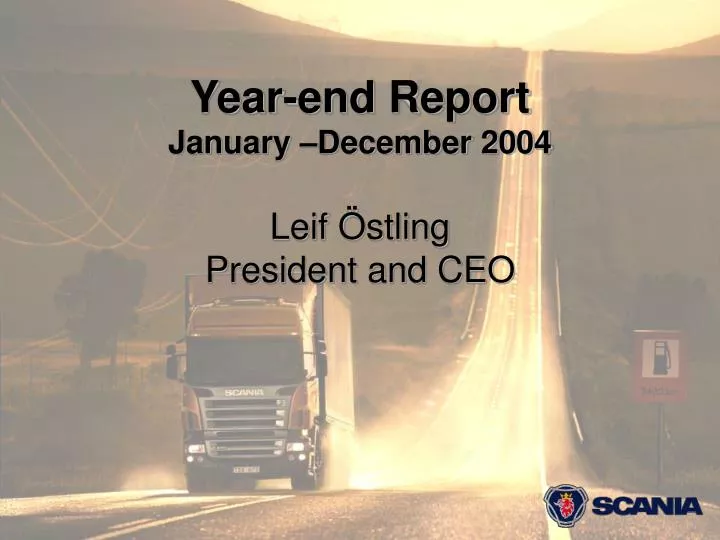
Year-end ReportJanuary –December 2004Leif ÖstlingPresident and CEO
Key figures Full year 2004 • Order bookings 59,981 vehicles +23% • Deliveries 56,082 vehicles +12% • Revenue SEK 56,788 m. +12% • Operating margin 11.2% (10.1%) • Net income SEK 4,077 m. +34% • Earnings per share SEK 20.39 (15.17) • Proposed dividend SEK 15.00 (6.00)
Total order bookings Trucks and bus chassis Units 16,000 14,000 12,000 10,000 8,000 6,000 4,000 2,000 0 Q1 Q2 Q3 Q4 Q1 Q2 Q3 Q4 Q1 Q2 Q3 Q4 Q1 Q2 Q3 Q4 2001 2002 2003 2004
Scania in brief Full year 2004 Deliveries by market Revenue by product area Used vehiclesetc. 12% South America 16% Africa, Asia and Oceania 16% Service-related products 20% Engines 1% Central and easternEurope 10% Buses 9% Trucks 58% Western Europe 58%
Market developmentsEurope - trucks Western Europe Central and eastern Europe • Increased demand in many markets, due to • Continued good growth • Increased order bookings and deliveries especially in Poland, Czech Republic and Russia • Replacement need • Continued exports of used vehicles to central and eastern Europe • Largest increases in the Nordic markets, Germany and Italy • European economic development?
Market developments Other markets - trucks Africa, Asia and Oceania South America • Growing total market • Scania market leader in Brazil • Continued growth in most markets • Increased order bookings especially in Taiwan, United Arab Emirates, Malaysia and Turkey
Buses and coaches • Deliveries reached highest level in Scania history • Order bookings rose by 34% Industrial and Marine engines • All time high in volumes • Order bookings rose by 59%
Year-end ReportJanuary – December 2004Jan GuranderGroup Vice President and CFO
Key figuresFull year 2004 • Vehicle deliveries 56,082 units +12% • Revenue SEK 56,788 m. +12% • Operating income SEK 6,337 m. +24% • Operating margin 11.2% (10.1%) • Net income SEK 4,077 m. +34% • Return on equity 20.8% (17.4%) • Return on capital employed 28.1% (22.0%)
Vehicle revenue SEK m. 12,000 10,000 8,000 6,000 4,000 2,000 0 Q1 Q2 Q3 Q4 Q1 Q2 Q3 Q4 Q1 Q2 Q3 Q4 Q1 Q2 Q3 Q4 2001 2002 2003 2004
Service revenue SEK m. 3,000 2,500 2,000 1,500 1,000 500 0 Q1 Q2 Q3 Q4 Q1 Q2 Q3 Q4 Q1 Q2 Q3 Q4 Q1 Q2 Q3 Q4 2001 2002 2003 2004
Operating incomeScania Group SEK m. Operating margin, % 2,500 16 14 2,000 12 10 1,500 8 1,000 6 4 500 2 0 0 Q1 Q2 Q3 Q4 Q1 Q2 Q3 Q4 Q1 Q2 Q3 Q4 Q1 Q2 Q3 Q4 2002 2001 2003 2004 Note: Excluding divested car operations
Operating incomeVehicles and Service SEK 5,887 m. • Higher volume • Capacity utilisation • Service business SEK 4,759 m. • R&D expenditures • Currency effect Full year 2003 Full year 2004
Operating incomeCustomer Finance SEK 450 m. SEK 366 m. • Interest margin • Lower credit losses • Operating expenses Full year 2003 Full year 2004
Size of portfolioCustomer Finance Operating income SEK m. SEK m. 30,000 500 25,000 400 20,000 300 15,000 200 10,000 100 5,000 0 0 1994 1995 1996 1997 1998 1999 2000 2001 2002 2003 2004
Cash flowVehicles and Service SEK m. 1,800 1,600 1,400 1,200 1,000 800 600 400 200 0 Q1 Q2 Q3 Q4 Q1 Q2 Q3 Q4 Q1 Q2 Q3 Q4 Q1 Q2 Q3 Q4 2001 2002 2003 2004 Note: Excluding acquisitions/divestmentsand Customer Finance
10,000 8,000 6,000 4,000 2,000 0 Q2 Q4 Q2 Q4 Q2 Q4 Q2 Q4 Net debtVehicles and Service SEK m. 2004 2001 2002 2003 Note: Excluding Customer Finance
Conclusions • Scania had a successful year in 2004 • Truck deliveries were high • Sales of buses as well as industrial and marine engines reached record levels • Service revenues showed continued good growth • Customer finance showed good development • Changeover without disruptions