Download

1 / 23
230 likes | 371 Vues
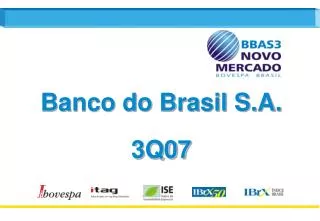
Banco do Brasil 3Q07 Results. 1,464. 1,409. 1,248. 907. 1,068. 832. 3Q06. 4Q06. 1Q07. 2Q07. Net Income. 35.9. 29.2. 31.0. 29.4. 29.4. 24.0. 26.7. 17.8. 19.8. 4,796. 26.3. 4,646. 20.9. 18.0. 1,582. 3,841. 1,364. 2,417. Δ Recurring Net Income – 90.2 %.

E N D
Banco do Brasil 3Q07 Results
1,464 1,409 1,248 907 1,068 832 3Q06 4Q06 1Q07 2Q07 Net Income 35.9 29.2 31.0 29.4 29.4 24.0 26.7 17.8 19.8 4,796 26.3 4,646 20.9 18.0 1,582 3,841 1,364 2,417 Δ Recurring Net Income – 90.2% Δ Recurring Net Income – 92.2% 3Q07 9M06 9M07 ROE (Annualized) - % Net Income – R$ million Recurring ROE (Annualized) - % Recurring Net Income – R$ million
Net Income Changes R$ million Recurring Net Income 2Q07 1,464 Income Taxes 116 Other Operating Income 82 Fee Revenues 61 Other Effects 11 Administrative Expenses 100 Net Interest Income 52 ( ) Recurring Net Income 3Q07 1,582 ( ) One-off Expenses 218 Net Income 3Q07 1,364
0.8 0.5 0.4 0.3 3.0 3.3 3.2 3.4 4.8 4.8 4.7 4.6 6.1 6.1 5.8 5.4 Net Interest Income 15.3 R$ billion 13.3 1.7 5.2 5.2 4.8 4.8 1.2 4.4 9.6 10.2 0.4 14.6 13.9 18.7 3.4 15.8 5.1 6.5 9M06 9M07 3Q06 4Q06 1Q07 2Q07 3Q07 Net Interest Income Loan Revenues Interest Expense Security Revenues Other Interest Revenues
Net Interest Income 14.6 13.6 12.9 12.3 11.5 8.2 8.4 8.1 8.0 7.5 3Q06 4Q06 1Q07 2Q07 3Q07 Annualized NIM by Loan Portfolio - % Average Selic Annualized - % NIM Annualized¹ - % 31.4 31.8 28.9 28.8 27.7 8.5 8.0 7.3 7.2 7.0 5.2 6.4 7.0 6.6 6.6 3Q06 4Q06 1Q07 2Q07 3Q07 (1) Net Interest Income over Earning Assets Individuals Businesses Agribusinesses
Long Exposure vs. Interest Rate Related to Selic - % 130.5 127.2 128.1 124.8 Investment Interest Rate 112.6 65.0 Funding Interest Rate 62.1 62.0 61.5 58.1 49.4 46.4 36.1 29.9 27.7 22.9 19.0 18.2 14.6 12.7 3Q06 4Q06 1Q07 2Q07 3Q07 Domestic Long Net Exposure - R$ billion Floating Rate Fixed Rate
145.2 140.4 133.2 12.2 12.3 118.3 12.2 27.9 26.1 10.4 24.0 23.2 48.8 46.8 45.1 40.3 56.3 55.2 51.9 44.4 Sep/06 Dec/06 Mar/07 Jun/07 Loan Portfolio R$ billion Δ % over Sep/06 Jun/07 26.9 3.4 150.2 20.4 2.8 12.6 27.3 5.7 29.5 20.1 (0.7) 48.4 34.3 5.9 59.7 Sep/07 Businesses Individuals Agribusinesses Abroad
27.9 26.1 24.0 23.,2 9.9 9.6 9.5 10.1 10.2 9.3 8.3 7.4 2.6 2.7 2.2 2.3 3.4 3.2 3.1 2.8 0.6 0.9 1.3 1.7 Loan Portfolio - Individuals R$ billion Δ % over 3Q06 2Q07 27.3 5.7 29.5 0.8 0.8 10.1 49.8 8.3 11.0 7.7 (2.0) 2.6 28.6 5.7 3.6 250.9 29.4 2.2 3Q06 4Q06 1Q07 2Q07 3Q07 Cars Loan Overdraft Account Credit Card Payroll Loan Others
222.7 221.9 213.9 214.0 175.1 173.1 170.1 166.2 Credit Risk Average Risk - % 6.9 6.2 6.2 6.0 5.8 6.7 BB Banking Industry 5.4 5.4 5.4 5.4 Required Provision / Past Due Loan + 90 days - % 202.8 167.7 BB Banking Industry 3Q06 4Q06 1Q07 2Q07 3Q07
Delinquency and Provision for Credit Risk 5.6 5.0 4.8 4.1 3.7 1,431 1,385 1,257 1,236 1,216 7.4 6.5 6.5 6.5 6.4 3Q06 4Q06 1Q07 2Q07 3Q07 5.2 Provision Expenses - R$ million 4.7 4.2 4.1 4.1 Provision Expenses / Loan Portfolio¹ - % 3.8 3.4 2.9 2.8 2.8 3Q06 4Q06 1Q07 2Q07 3Q07 Provision / Loan Portfolio - % Past Over Due Loans + 15 days / Loan Portfolio - % (1) Average Portfolio and Expenses of the past 12 months Past Over Due Loans + 60 days / Loan Portfolio - %
Credit Risk Provisions Breakdown R$ million 9,663 9,441 9,133 8,757 8,635 1,580 548 1,655 1,582 1,397 8,209 8,084 7,786 7,551 7,238 Sep/06 Dec/06 Mar/07 Sep/07 Jun/07 Total Provision Required Provision Additional Provision
Deposits Δ % over Sep/06 Jun/07 R$ billion 18.8 4.6 172.2 164.5 160.7 158.8 4.6 10.1 6.0 5.4 5.3 144.9 5.2 5.7 83.6 15.7 2.7 81.4 76.9 80.9 72.3 38.7 36.8 40.1 35.6 19.3 5.1 32.4 43.8 27.2 7.3 40.8 38.9 36.7 34.4 Sep/06 Dec/06 Mar/07 Jun/07 Sep/07 Saving Deposits Demand Deposits Time Deposits Others
Fee Income R$ million Δ % over 3Q06 2Q07 10.9 2.5 2,498 2,437 2,377 2,287 2,252 25.6 6.6 352 330 300 293 280 10.3 1.6 727 716 703 672 659 8.1 2.0 1,419 1,391 1,373 1,322 1,313 3Q06 4Q06 1Q07 2Q07 3Q07 Products Customers Others
24.9 24.6 24.4 24.1 1.6 1.6 1.6 1.5 23.3 23.0 22.8 22.6 3Q06 4Q06 1Q07 2Q07 Customers and Asset Management 19.7 19.1 19.1 19.1 18.1 208.9 206.9 193.1 182.7 180.6 Δ= (1.0)% Δ= 14.5% Customers - million 3Q07 3Q06 4Q06 1Q07 2Q07 25.2 1.6 Market Share - % Assets under Management - R$ billion 23.6 3Q07 Individuals Companies
316 315 300 250 3Q06 4Q06 2Q07 1Q07 Insurance Value Added¹ - R$ million 294 Δ= (7.0)% Δ= 17.6% 3Q07 (1) Includes equity income, fee income, brokage and asset management income
558 560 508 4Q06 1Q07 2Q07 Credit Cards Value Added¹ - R$ million 542 495 Δ= (3.2)% Δ= 9.4% 3Q06 3Q07 (1) Includes fee income, financing income, equity income and others
Credit Cards 17.8 15.7 14.4 14.1 11.4 12.3 11.5 10.9 11.2 9.4 Δ= 7.0% Δ= 30.6% 3Q07 3Q06 4Q06 1Q07 2Q07 Credit Cards - million (1) Includes Credit Cards and Debit Cards Revenue¹ - R$ billion
Administrative Expenses R$ million Δ % over 3Q06 2Q07 4.7 3.1 3,362 3,331 3,232 3,182 3,149 1,516 14.1 3.5 1,378 1,519 1,572 1,401 1,846 1,804 (2.5) 2.7 1,748 1,713 1,759 3Q06 4Q06 1Q07 2Q07 3Q07 Personnel Expenses¹ Other Administrative Expenses¹ (1) Legal risk and extraordinary items are not included.
9.9 10.2 10.1 9.8 82.7 82.6 82.5 79.3 3Q06 4Q06 1Q07 2Q07 Human Resources and Logistics Workforce - thousand 9.5 80.0 Points of Service - thousand 3Q07 15.1 15.2 15.2 15.0 15.1 Employees Interns 4.0 4.0 4.0 4.0 4.0 11.1 11.2 11.2 11.2 11.0 3Q06 4Q06 1Q07 2Q07 3Q07 Branches Others
2.5 2.4 2.4 2.3 2.2 2.0 1.9 1.9 Productivity Ratio R$ billion 130.6 130.2 127.9 113.4 112.9 110.1 107.2 2.5 2.4 3Q07 3Q06 4Q06 1Q07 2Q07 Recurring Coverage Ratio¹ - % Fee Income Coverage Ratio¹ - % Personnel Expenses (1) Year to Date
Productivity Ratio R$ billion 50.8 49.1 47.5 46.5 44.1 44.7 45.5 7.7 7.7 7.5 7.1 7.1 4.2 4.2 3.6 3.4 3.3 3Q06 4Q06 1Q07 2Q07 3Q07 Recurring Efficiency Ratio¹ - % Administrative Expenses Efficiency Ratio¹ - % Operating Income (1) Year to Date
BIS Ratio % 17.7 17.3 17.2 15.9 15.7 5.8 5.6 5.5 5.3 5.2 11.9 11.6 11.6 10.6 10.5 Sep/06 Dec/06 Mar/07 Jun/07 Sep/07 Tier I Tier II
For further information access www.bb.com.br/ri Investor Relations Unit SBS - Quadra 1 - Bloco C - Ed. Sede III - 5° floor 70073-901 - Brasília (DF) Phone: 55 (61) 3310.3980 Fax: 55 (61) 3310.3735 www.bb.com.br ri@bb.com.br Disclaimer- This presentation contains references and statements, planned synergies, increasing estimates, projections of results and future strategy for Banco do Brasil, it’s Associated and Affiliated Companies and Subsidiaries. Although these references and statements reflect the management’s belief, it also involves imprecision and high difficult risks to be foreseen, consequently, it may conduct to a different result than the one anticipated here. These expectations are highly depended on market conditions, on the Brazilian economic performance, on the sector and the international market. Banco do Brasil is not responsible for bringing up to date any estimate in this presentation.