Download
1 / 30
300 likes | 542 Vues
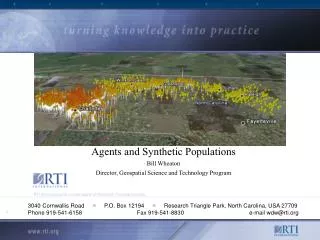
Agents and Synthetic Populations Bill Wheaton Director, Geospatial Science and Technology Program. RTI International is a trade name of Research Triangle Institute. 3040 Cornwallis Road ■ P.O. Box 12194 ■ Research Triangle Park, North Carolina, USA 27709 .

E N D
Agents and Synthetic Populations Bill Wheaton Director, Geospatial Science and Technology Program RTI International is a trade name of Research Triangle Institute 3040 Cornwallis Road ■ P.O. Box 12194 ■ Research Triangle Park, North Carolina, USA 27709 Phone 919-541-6158 Fax 919-541-8830 e-mail wdw@rti.org
Acknowledgments • This work funded under the Models of Infectious Disease Agent Study (MIDAS) for the National Institute of General Medical Sciences (NIGMS) • RTI wishes to thank Irene Eckstrand and the MIDAS Steering Committee for funding and support. • Prior Research and Techniques: • Beckman, Richard J., Baggerly, Keith A., McKay, Michael D., “Creating Synthetic Baseline Populations”, Transportation Research, Vol. 30, No. 6, pp. 415-429, 1996. • Norman, Paul, “Putting Iterative Proportional Fitting on the Researcher’s Desk.” Working Paper 99/03, School of Geography, University of Leeds. • TranSims: Transportation Analysis Simulation System. • http://transims.tsasa.lanl.gov
Microsimulation and Synthetic Populations • “Microsimulation methodologies aim at building large-scale data sets on the attributes of individuals or households…and at analyzing policy impacts on these micro-units through the simulation of economic, demographic and social processes.” • “If we do not have a micro data base on individuals and households then there is a necessity to simulate one” -- Ballas, D., Clarke, G., Turton, I. “Exploring Microsimulation Methodologies for the Estimation of Household Attributes”, paper presented at the 4th International conference on GeoComputation, Mary Washington College, VA., 25-28 July 1999.
Agent Complexity • Mainly concerned with the number of characteristics of agents and possible behaviors • Can also be concerned with relationships to other agents and the environment • Family, cohort, community • Spatial relationships– location, nearness, adjacency, within • Network connections • ‘Spatial’ vs. ‘Geospatial’
Zombie Apocalypse Agents • Zombies: • Movement Rate • Vision Distance • Vision Angle • Humans • Movement Rate • Vision Distance • Vision Angle • Universal Conversion Rate • Skill • Skill-kill
Micro (Individual) vs. Macro (Aggregate) Data • Macro/Aggregate Data: • Census counts by geographic area • State, County, Census Tract, Block Group • Does not provide information on household structure • Micro/Individual Data: • Individual or Household-level data • Household structure maintained
Data Driven Agents • Source and complexity of data about agents varies • Count data– how many agents to create? • Farms by county; hives/hectare; city population; purely abstract • Quantity may depend on computational resources or complexity of the model specification • Characteristics • Distributions (age, sex, occupation, min/max/mean school size)…census data, etc. • Individual characteristics: Public Use Microdata for persons; schools data; workplace data;
Creating a Synthetic Population: Data Inputs and Techniques • Block-group Level Demographics • SF3 (2000 decennial census) • Public Use Microdata (PUMS) • Actual Census long-form records (from U.S. Bureau of the Census, 2000) • Household and individual level data • Family structure maintained • 5% Sample within Public Use Microdata Areas (PUMAs) • PUMAs contain about 100,000 persons • Household Locations • Placed based on high resolution LandScan population data • Population at 90-meter grid cell resolution • Iterative Proportional Fitting (IPF) • Uses conditional probabilities to fill out a synthetic population that matches SF3 counts based on PUMS microdata samples.
Geographical Context • Counties • Census Tracts • Block Groups • Public Use Microdata Areas (PUMAs) • Households • “Clone” particular records of the 5% PUMS sample (red outlines) to match census counts at block group level (black outlines)
Transims Population Generator • Transims: A transportation modeling package developed at Los Alamos National Lab • Became the basis for EpiSims infectious disease modeling software • Included development of code that uses IPF to generate a synthetic population • Details in: Beckman, Richard J., “Creating Synthetic Baseline Populations”, Transportation Research, Vol 30, No.6, pp 415-429, 1996
Iterative Proportional Fitting (IPF) • Conditional Probabilities • Use known information in PUMA to specify proportions in multi-way block group tables • See next slide, but be prepared
Block Group PUMA PUMA Block Group
IPF Attributes for MIDAS Works on HOUSEHOLD Attributes • The MIDAS Synthetic Population Uses: • Household Size • Age of Head of Householder • Vehicles Available • Household Income • Other household attributes could be used in future
Example Households and Persons Household Persons
Dasymetric Household Placement Dasymetric Process: Household points located relative to high resolution population density, not census block group polygons Population in Block Groups homogenously distributed if only using census data In reality, population is heterogeneously distributed within block groups Light areas have high populations The BG’s population located here… …not out here…
Group Quarters • Account for 2.7% of U.S. population: 7,778,633 • RTI method synthesized: • Nursing Homes (1,720,500 persons) • Prisons (1,976,019 person) • College Dormitories (2,064,128 persons) • Military Barracks (355,155 persons) • Accounting for 6,115,802 of the 7,778,633 persons in group quarters • Locations based on external data sources and census • Counts of individuals based on census, by group quarters type and block group • Age distributions of synthesized persons based on external data or U.S. age distributions
Group Quarters Butner Correctional Institution • Most areas have no GQ populations • Those that DO, may have significant influence on your model White: no GQ; Yellow: 0-20%; etc.; Dark Blue: 80-100%
U.S. Synthetic Population Results • Households • 105,480,101 generated vs. 104,926,825 in census • X,Y locations • Household attributes • Persons • In households: 273,624,650 generated vs. 281,421,906 • In Group Quarters: (6,115,802) • Individual attributes (age, sex, etc.) • Closely Matches Census Counts • Built-in Social Networks: family, school, workplace
Schools Assignments • After creating basic population; assign students to schools • Have nationwide schools: location; grades, capacity • Use distance to assign students to school by age/grade and capacity
Workplace Assignments • Assign adults in workforce to workplaces • Have: counts of business by size by census tract • STP64 data on counts of people by place of residence/place of work • Allocate working age adults to businesses in tracts based on STP64
Workplaces by Occupation/Type • In general, we don’t assign workers to workplaces based on occupation. Data does not support it. • In some cases we use existing sets of workplaces and simply assign them to a particular ‘type’: school; hospital; gym/exercise club.
Global Synthetic Populations • Simple synthetic populations based on population counts and density by 1KM grid cell can be done globally (LandScan) • Household-based synthetic populations are possible where public use microdata is available (35+ countries) • RTI has synthetic populations for Mexico, Thailand, Niger, Cambodia, Pakistan, and India (1.1 Billion records in the table!)
Global Data Examples • Pakistan • Mexico • Thailand • Ratchiburri
Census Data Changes • Major Changes in Census data in the U.S. in 2010. • The decennial census • ‘enumeration’ of the population • Mandated by the Constitution • Congressional re-apportionment • Short form vs. Long form • American Community Survey • ‘characteristics’ of the population • Continuous survey started in the mid-1990s • Replaces the long form • Smaller sample– larger standard errors • 1-year, 3-year, 5-year estimates • New data every year.
Synthetic Population Plans • Develop new U.S. Synthetic Population with 2005-2009 ACS data • Use Race instead of Vehicles Available • May need to match on census tract rather than block group • Develop custom synthetic population generator • Web-based • User chooses the variables of interest and study area • Generates new data and makes available for download • Look into doing a new dataset every year (funding?)
Potential Issues with 2005-2009 Data • Group Quarters: • Some serious issues with how ACS collects group quarters data; accuracy issues. • Workplace Assignments: • STP64 from 2000 is ‘Special Tabulation’ • Will Census make this file again for each ACS distribution?
Contextual Characteristics • Add new variables to each synthetic household • Elevation, distance to water, landuse type, in/out of flood zone, air quality, etc. • Indexes: social vulnerability, walkability, access to health care, etc.
Other Uses of Synthetic Population Data • Risk and Exposure Assessment • Emergency Evacuation
Livestock Synthetic Populations • Poultry • Farms by count of animals, by county • Layers, broilers, pullets • Create GIS poultry farm suitability layer • Place synthetic farms based on suitability index
Sample Synthetic Data • Samples available from: • https://www.epimodels.org/midas/pubsyntdata1.do • Five counties (small and large) • Documentation • Poultry, Hog data