Download
1 / 1
10 likes | 52 Vues
Axis Direct presents daily derivatives report presenting recommendations based on technical analysis. For trading in derivatives visit https://simplehai.axisdirect.in/offerings/products/derivatives<br>https://simplehai.axisdirect.in/share-stock-prices/nse/Canara-Bank-5471<br>

E N D
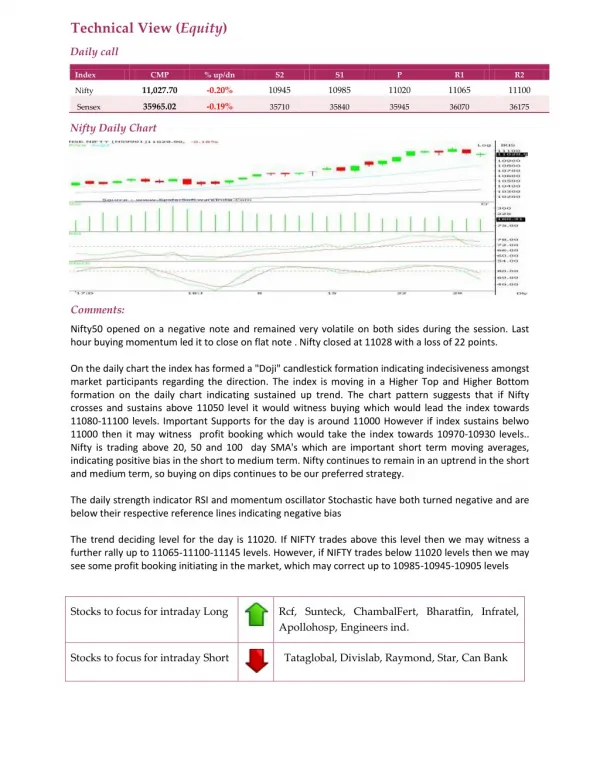
Technical View (Equity) Daily call Index CMP % up/dn S2 S1 P R1 R2 11,027.70 -0.20% 10945 10985 11020 11065 11100 Nifty 35965.02 -0.19% Sensex 35710 35840 35945 36070 36175 Nifty Daily Chart Comments: Nifty50 opened on a negative note and remained very volatile on both sides during the session. Last hour buying momentum led it to close on flat note . Nifty closed at 11028 with a loss of 22 points. On the daily chart the index has formed a "Doji" candlestick formation indicating indecisiveness amongst market participants regarding the direction. The index is moving in a Higher Top and Higher Bottom formation on the daily chart indicating sustained up trend. The chart pattern suggests that if Nifty crosses and sustains above 11050 level it would witness buying which would lead the index towards 11080-11100 levels. Important Supports for the day is around 11000 However if index sustains belwo 11000 then it may witness profit booking which would take the index towards 10970-10930 levels.. Nifty is trading above 20, 50 and 100 day SMA's which are important short term moving averages, indicating positive bias in the short to medium term. Nifty continues to remain in an uptrend in the short and medium term, so buying on dips continues to be our preferred strategy. The daily strength indicator RSI and momentum oscillator Stochastic have both turned negative and are below their respective reference lines indicating negative bias The trend deciding level for the day is 11020. If NIFTY trades above this level then we may witness a further rally up to 11065-11100-11145 levels. However, if NIFTY trades below 11020 levels then we may see some profit booking initiating in the market, which may correct up to 10985-10945-10905 levels Stocks to focus for intraday Long Rcf, Sunteck, ChambalFert, Bharatfin, Infratel, Apollohosp, Engineers ind. Stocks to focus for intraday Short Tataglobal, Divislab, Raymond, Star, Can Bank