Download
1 / 2
20 likes | 36 Vues
Axis Direct presents daily derivatives report presenting recommendations based on technical analysis. For trading in derivatives visit https://simplehai.axisdirect.in/offerings/products/derivatives

E N D
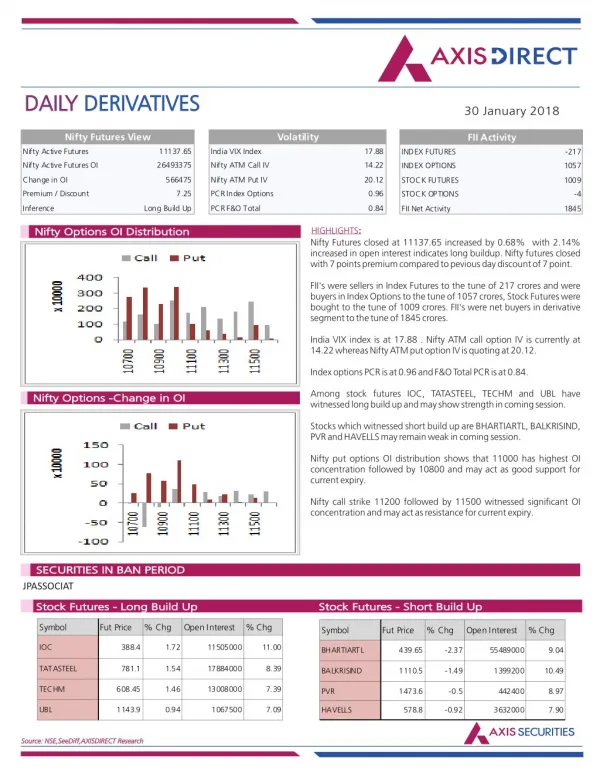
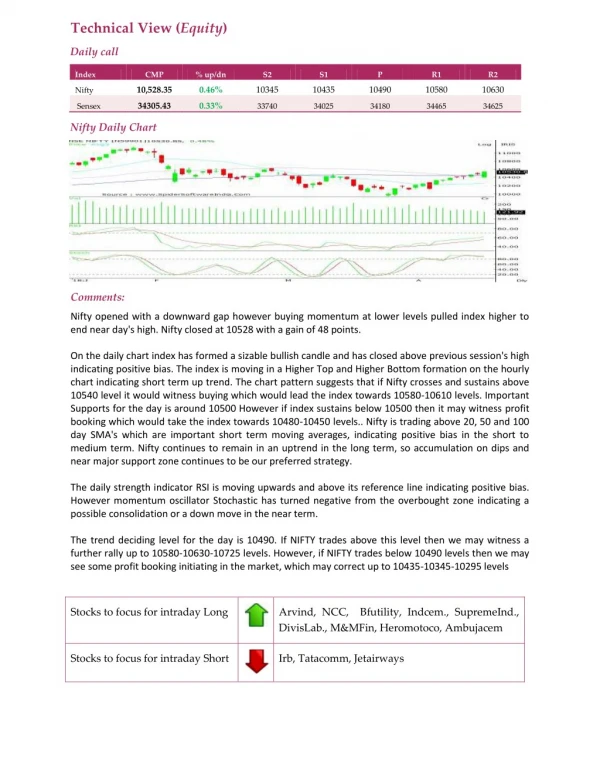
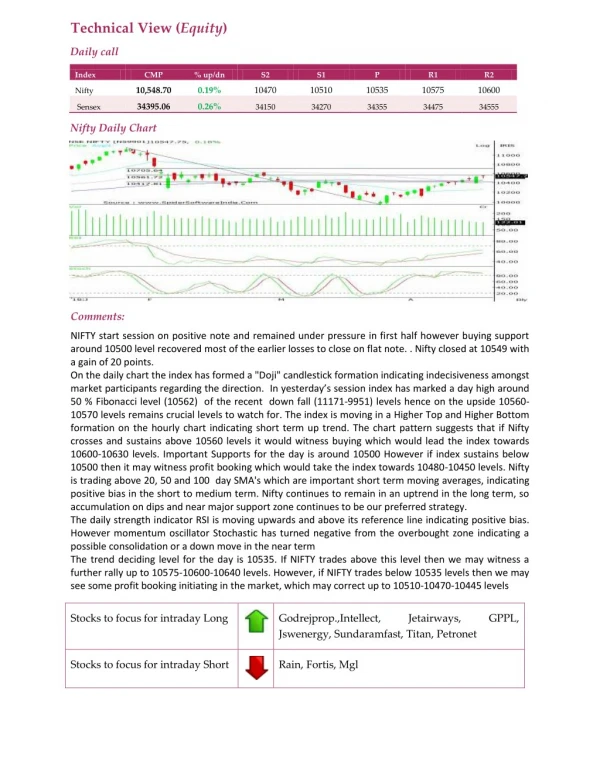
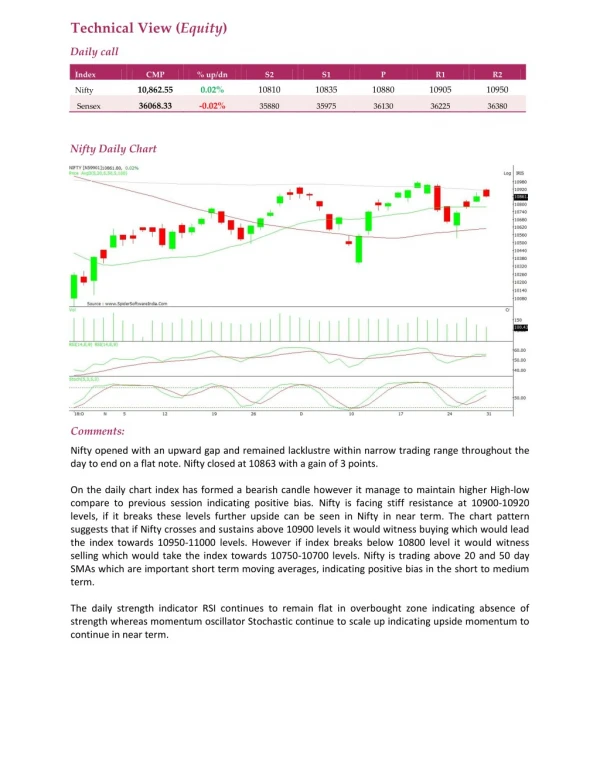
Technical View (Equity) Daily call Index CMP % up/dn S2 S1 P R1 R2 10,862.55 0.02% 10810 10835 10880 10905 10950 Nifty 36068.33 -0.02% Sensex 35880 35975 36130 36225 36380 Nifty Daily Chart Comments: Nifty opened with an upward gap and remained lacklustre within narrow trading range throughout the day to end on a flat note. Nifty closed at 10863 with a gain of 3 points. On the daily chart index has formed a bearish candle however it manage to maintain higher High-low compare to previous session indicating positive bias.Nifty is facing stiff resistance at 10900-10920 levels, if it breaks these levels further upside can be seen in Nifty in near term. The chart pattern suggests that if Nifty crosses and sustains above 10900 levels it would witness buying which would lead the index towards 10950-11000 levels. However if index breaks below 10800 level it would witness selling which would take the index towards 10750-10700 levels. Nifty is trading above 20 and 50 day SMAs which are important short term moving averages, indicating positive bias in the short to medium term. The daily strength indicator RSI continues to remain flat in overbought zone indicating absence of strength whereas momentum oscillator Stochastic continue to scale up indicating upside momentum to continue in near term.
The trend deciding level for the day is 10880. If NIFTY trades above this level then we may witness a further rally up to 10905-10950-10975 levels. However, if NIFTY trades below 10880 levels then we may see some profit booking initiating in the market, which may correct up to 10835-10810-10765 levels Stocks to focus for intraday Long Indusindbk, Jswsteel, Sunpharma, Godrejind, Colpal Stocks to focus for intraday Short Bhartiartl, Maruti Coalindia, Heromotoco, Infratel,