Download
1 / 1
10 likes | 22 Vues
Axis Direct presents daily derivatives report presenting recommendations based on technical analysis. For trading in derivatives visit https://simplehai.axisdirect.in/offerings/products/derivatives<br>https://simplehai.axisdirect.in/share-stock-prices/nse/Asian-Paints-Ltd-34<br>https://simplehai.axisdirect.in/share-stock-prices/nse/Cipla-Ltd-114<br>https://simplehai.axisdirect.in/share-stock-prices/nse/ICICI-Bank-Ltd-5418<br>

E N D
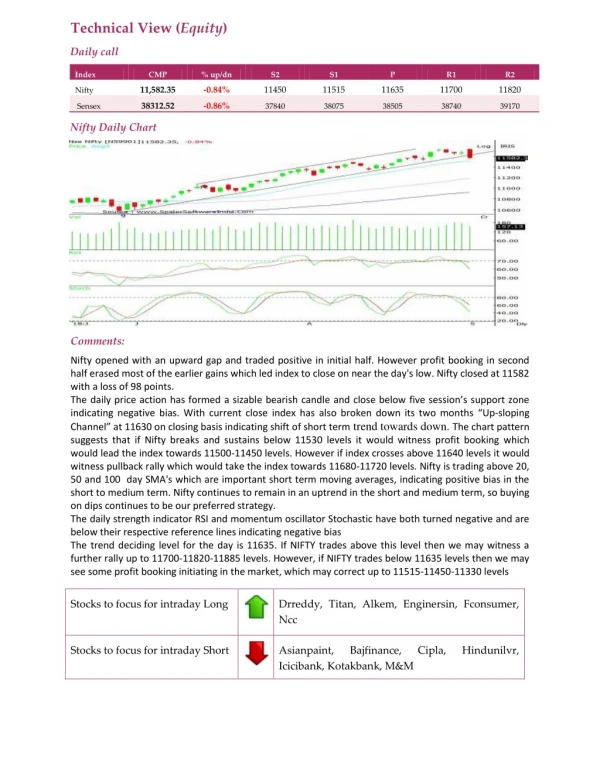
Technical View (Equity) Daily call Index CMP % up/dn S2 S1 P R1 R2 11,582.35 -0.84% 11450 11515 11635 11700 11820 Nifty 38312.52 -0.86% Sensex 37840 38075 38505 38740 39170 Nifty Daily Chart Comments: Nifty opened with an upward gap and traded positive in initial half. However profit booking in second half erased most of the earlier gains which led index to close on near the day's low. Nifty closed at 11582 with a loss of 98 points. The daily price action has formed a sizable bearish candle and close below five session’s support zone indicating negative bias. With current close index has also broken down its two months “Up-sloping Channel” at 11630 on closing basis indicating shift of short term trend towards down. The chart pattern suggests that if Nifty breaks and sustains below 11530 levels it would witness profit booking which would lead the index towards 11500-11450 levels. However if index crosses above 11640 levels it would witness pullback rally which would take the index towards 11680-11720 levels. Nifty is trading above 20, 50 and 100 day SMA's which are important short term moving averages, indicating positive bias in the short to medium term. Nifty continues to remain in an uptrend in the short and medium term, so buying on dips continues to be our preferred strategy. The daily strength indicator RSI and momentum oscillator Stochastic have both turned negative and are below their respective reference lines indicating negative bias The trend deciding level for the day is 11635. If NIFTY trades above this level then we may witness a further rally up to 11700-11820-11885 levels. However, if NIFTY trades below 11635 levels then we may see some profit booking initiating in the market, which may correct up to 11515-11450-11330 levels Stocks to focus for intraday Long Drreddy, Titan, Alkem, Enginersin, Fconsumer, Ncc Stocks to focus for intraday Short Asianpaint, Icicibank, Kotakbank, M&M Bajfinance, Cipla, Hindunilvr,