Download
1 / 1
10 likes | 54 Vues
Axis Direct presents daily derivatives report presenting recommendations based on technical analysis. For trading in derivatives visit https://simplehai.axisdirect.in/offerings/products/derivatives<br>https://simplehai.axisdirect.in/share-stock-prices/nse/Jet-Airways-(India)-Ltd-5586<br>https://simplehai.axisdirect.in/share-stock-prices/nse/Lupin-Ltd-3026<br>https://simplehai.axisdirect.in/share-stock-prices/nse/Tech-Mahindra-Ltd-17215<br>https://simplehai.axisdirect.in/share-stock-prices/nse/Tata-Consultancy-Services-Ltd-5400<br>

E N D
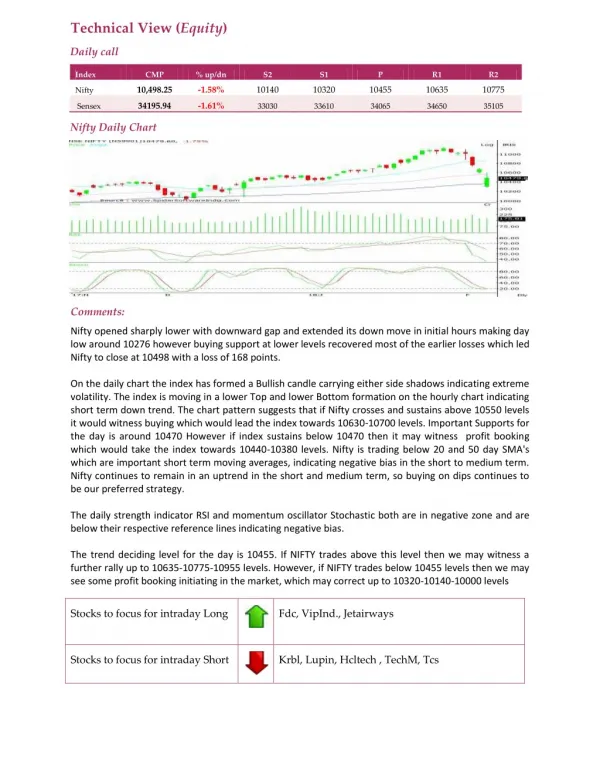
Technical View (Equity) Daily call Index CMP % up/dn S2 S1 P R1 R2 10,498.25 -1.58% 10140 10320 10455 10635 10775 Nifty 34195.94 -1.61% Sensex 33030 33610 34065 34650 35105 Nifty Daily Chart Comments: Nifty opened sharply lower with downward gap and extended its down move in initial hours making day low around 10276 however buying support at lower levels recovered most of the earlier losses which led Nifty to close at 10498 with a loss of 168 points. On the daily chart the index has formed a Bullish candle carrying either side shadows indicating extreme volatility. The index is moving in a lower Top and lower Bottom formation on the hourly chart indicating short term down trend. The chart pattern suggests that if Nifty crosses and sustains above 10550 levels it would witness buying which would lead the index towards 10630-10700 levels. Important Supports for the day is around 10470 However if index sustains below 10470 then it may witness profit booking which would take the index towards 10440-10380 levels. Nifty is trading below 20 and 50 day SMA's which are important short term moving averages, indicating negative bias in the short to medium term. Nifty continues to remain in an uptrend in the short and medium term, so buying on dips continues to be our preferred strategy. The daily strength indicator RSI and momentum oscillator Stochastic both are in negative zone and are below their respective reference lines indicating negative bias. The trend deciding level for the day is 10455. If NIFTY trades above this level then we may witness a further rally up to 10635-10775-10955 levels. However, if NIFTY trades below 10455 levels then we may see some profit booking initiating in the market, which may correct up to 10320-10140-10000 levels Stocks to focus for intraday Long Fdc, VipInd., Jetairways Stocks to focus for intraday Short Krbl, Lupin, Hcltech , TechM, Tcs