Download
1 / 1
10 likes | 40 Vues
Axis Direct presents daily derivatives report presenting recommendations based on technical analysis. For trading in derivatives visit https://simplehai.axisdirect.in/offerings/products/derivatives<br>https://simplehai.axisdirect.in/share-stock-prices/nse/Ashok-Leyland-Ltd-31

E N D
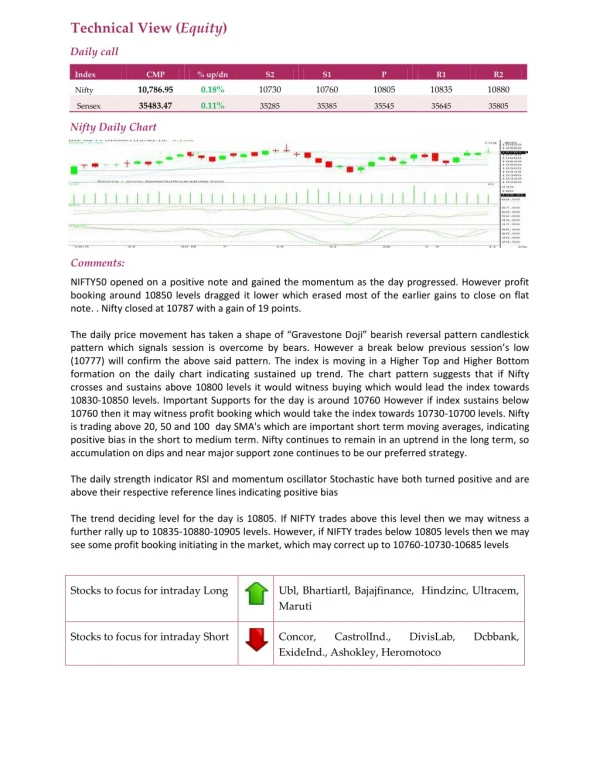
Technical View (Equity) Daily call Index CMP % up/dn S2 S1 P R1 R2 10,786.95 0.18% 10730 10760 10805 10835 10880 Nifty 35483.47 0.11% Sensex 35285 35385 35545 35645 35805 Nifty Daily Chart Comments: NIFTY50 opened on a positive note and gained the momentum as the day progressed. However profit booking around 10850 levels dragged it lower which erased most of the earlier gains to close on flat note. . Nifty closed at 10787 with a gain of 19 points. The daily price movement has taken a shape of “Gravestone Doji” bearish reversal pattern candlestick pattern which signals session is overcome by bears. However a break below previous session’s low (10777) will confirm the above said pattern. The index is moving in a Higher Top and Higher Bottom formation on the daily chart indicating sustained up trend. The chart pattern suggests that if Nifty crosses and sustains above 10800 levels it would witness buying which would lead the index towards 10830-10850 levels. Important Supports for the day is around 10760 However if index sustains below 10760 then it may witness profit booking which would take the index towards 10730-10700 levels. Nifty is trading above 20, 50 and 100 day SMA's which are important short term moving averages, indicating positive bias in the short to medium term. Nifty continues to remain in an uptrend in the long term, so accumulation on dips and near major support zone continues to be our preferred strategy. The daily strength indicator RSI and momentum oscillator Stochastic have both turned positive and are above their respective reference lines indicating positive bias The trend deciding level for the day is 10805. If NIFTY trades above this level then we may witness a further rally up to 10835-10880-10905 levels. However, if NIFTY trades below 10805 levels then we may see some profit booking initiating in the market, which may correct up to 10760-10730-10685 levels Stocks to focus for intraday Long Ubl, Bhartiartl, Bajajfinance, Hindzinc, Ultracem, Maruti Stocks to focus for intraday Short Concor, ExideInd., Ashokley, Heromotoco CastrolInd., DivisLab, Dcbbank,