Download
1 / 1
10 likes | 34 Vues
Axis Direct presents daily derivatives report presenting recommendations based on technical analysis. For trading in derivatives visit https://simplehai.axisdirect.in/offerings/products/derivatives<br>https://simplehai.axisdirect.in/share-stock-prices/nse/Bank-of-India-5654<br>https://simplehai.axisdirect.in/share-stock-prices/nse/Bharat-Petroleum-Corporation-Ltd-2290<br>

E N D
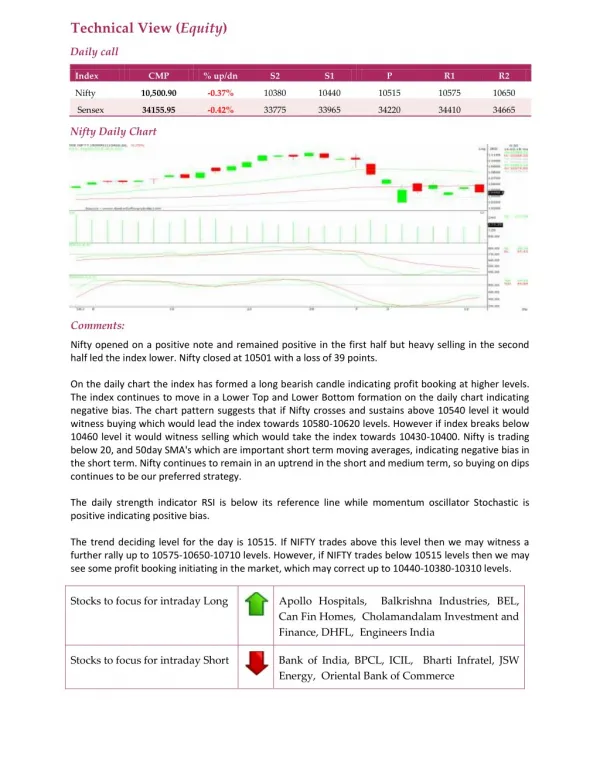
Technical View (Equity) Daily call Index CMP % up/dn S2 S1 P R1 R2 Nifty 10,500.90 -0.37% 10380 10440 10515 10575 10650 Sensex 34155.95 -0.42% 33775 33965 34220 34410 34665 Nifty Daily Chart Comments: Nifty opened on a positive note and remained positive in the first half but heavy selling in the second half led the index lower. Nifty closed at 10501 with a loss of 39 points. On the daily chart the index has formed a long bearish candle indicating profit booking at higher levels. The index continues to move in a Lower Top and Lower Bottom formation on the daily chart indicating negative bias. The chart pattern suggests that if Nifty crosses and sustains above 10540 level it would witness buying which would lead the index towards 10580-10620 levels. However if index breaks below 10460 level it would witness selling which would take the index towards 10430-10400. Nifty is trading below 20, and 50day SMA's which are important short term moving averages, indicating negative bias in the short term. Nifty continues to remain in an uptrend in the short and medium term, so buying on dips continues to be our preferred strategy. The daily strength indicator RSI is below its reference line while momentum oscillator Stochastic is positive indicating positive bias. The trend deciding level for the day is 10515. If NIFTY trades above this level then we may witness a further rally up to 10575-10650-10710 levels. However, if NIFTY trades below 10515 levels then we may see some profit booking initiating in the market, which may correct up to 10440-10380-10310 levels. Apollo Hospitals, Balkrishna Industries, BEL, Can Fin Homes, Cholamandalam Investment and Finance, DHFL, Engineers India Stocks to focus for intraday Long Bank of India, BPCL, ICIL, Bharti Infratel, JSW Energy, Oriental Bank of Commerce Stocks to focus for intraday Short