Download
1 / 1
10 likes | 26 Vues
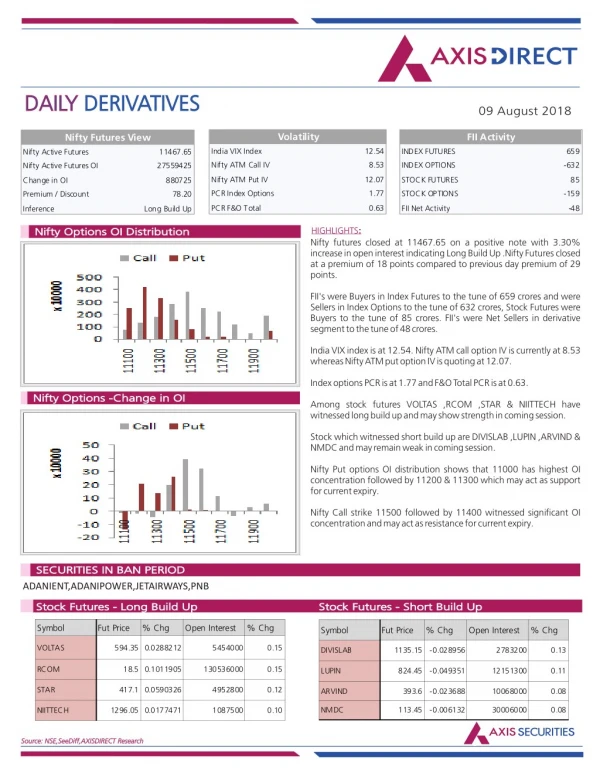
Axis Direct presents daily derivatives report presenting recommendations based on technical analysis. For trading in derivatives visit https://simplehai.axisdirect.in/offerings/products/derivatives<br>https://simplehai.axisdirect.in/share-stock-prices/nse/ICICI-Bank-Ltd-5418<br><br>

E N D
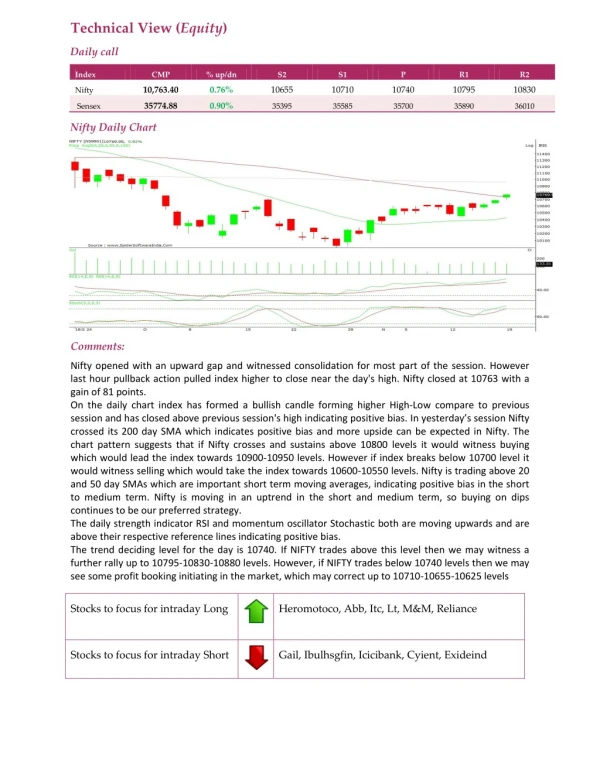
Technical View (Equity) Daily call Index CMP % up/dn S2 S1 P R1 R2 10,763.40 0.76% 10655 10710 10740 10795 10830 Nifty 35774.88 0.90% Sensex 35395 35585 35700 35890 36010 Nifty Daily Chart Comments: Nifty opened with an upward gap and witnessed consolidation for most part of the session. However last hour pullback action pulled index higher to close near the day's high. Nifty closed at 10763 with a gain of 81 points. On the daily chart index has formed a bullish candle forming higher High-Low compare to previous session and has closed above previous session's high indicating positive bias. In yesterday’s session Nifty crossed its 200 day SMA which indicates positive bias and more upside can be expected in Nifty. The chart pattern suggests that if Nifty crosses and sustains above 10800 levels it would witness buying which would lead the index towards 10900-10950 levels. However if index breaks below 10700 level it would witness selling which would take the index towards 10600-10550 levels. Nifty is trading above 20 and 50 day SMAs which are important short term moving averages, indicating positive bias in the short to medium term. Nifty is moving in an uptrend in the short and medium term, so buying on dips continues to be our preferred strategy. The daily strength indicator RSI and momentum oscillator Stochastic both are moving upwards and are above their respective reference lines indicating positive bias. The trend deciding level for the day is 10740. If NIFTY trades above this level then we may witness a further rally up to 10795-10830-10880 levels. However, if NIFTY trades below 10740 levels then we may see some profit booking initiating in the market, which may correct up to 10710-10655-10625 levels Stocks to focus for intraday Long Heromotoco, Abb, Itc, Lt, M&M, Reliance Stocks to focus for intraday Short Gail, Ibulhsgfin, Icicibank, Cyient, Exideind