Download
1 / 1
10 likes | 29 Vues
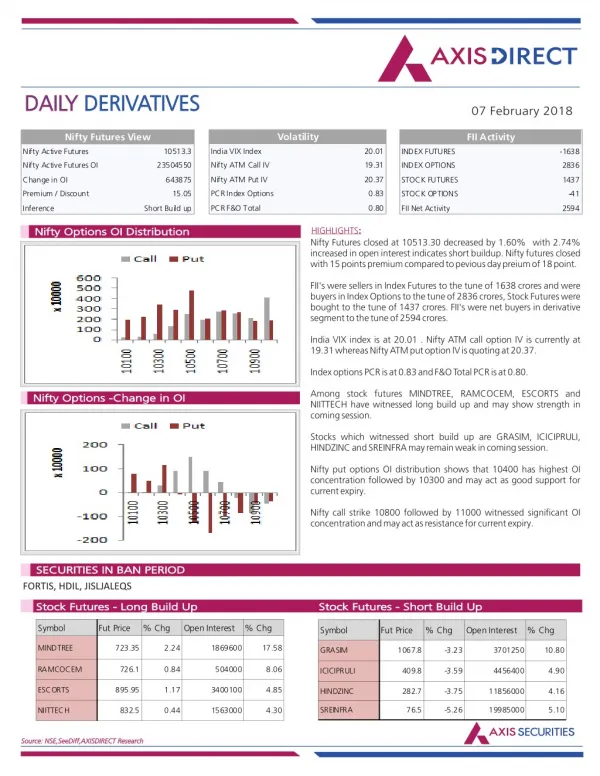
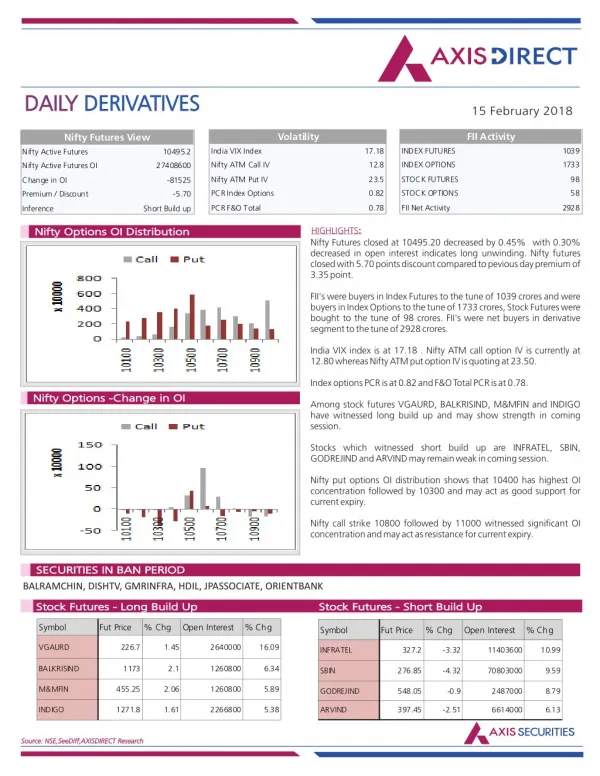
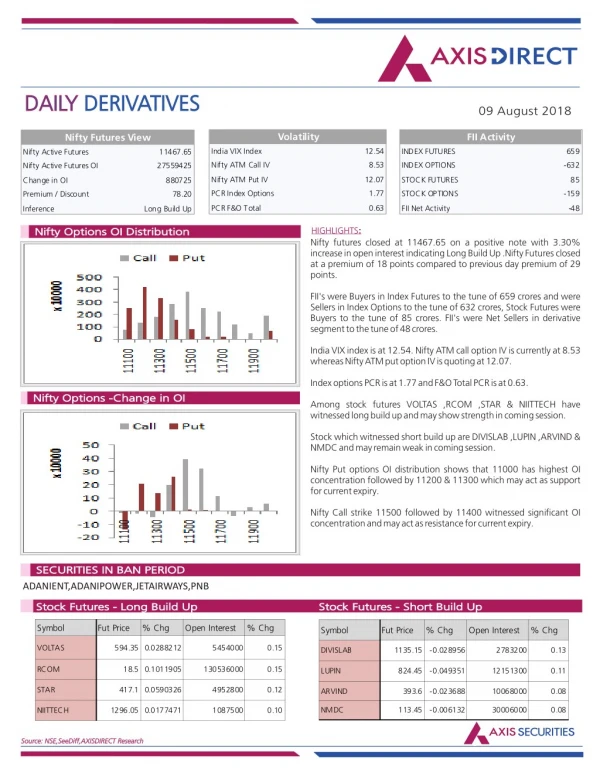
Axis Direct presents daily derivatives report presenting recommendations based on technical analysis. For trading in derivatives visit https://simplehai.axisdirect.in/offerings/products/derivatives<br>https://simplehai.axisdirect.in/share-stock-prices/nse/Adani-Ports-&-Special-Economic-Zone-Ltd-21281<br>https://simplehai.axisdirect.in/share-stock-prices/nse/Coal-India-Ltd-12019<br>https://simplehai.axisdirect.in/share-stock-prices/nse/ICICI-Bank-Ltd-5418<br>https://simplehai.axisdirect.in/share-stock-prices/nse/Infosys-Ltd-2806<br>

E N D
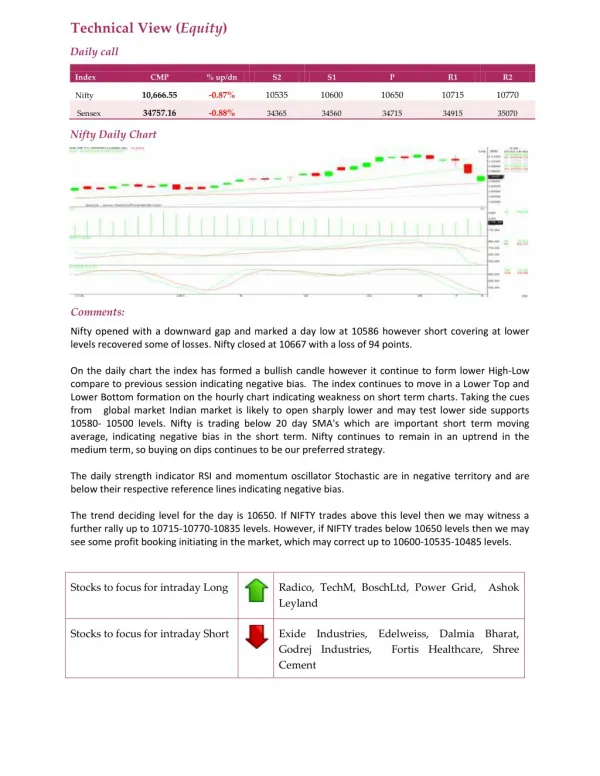
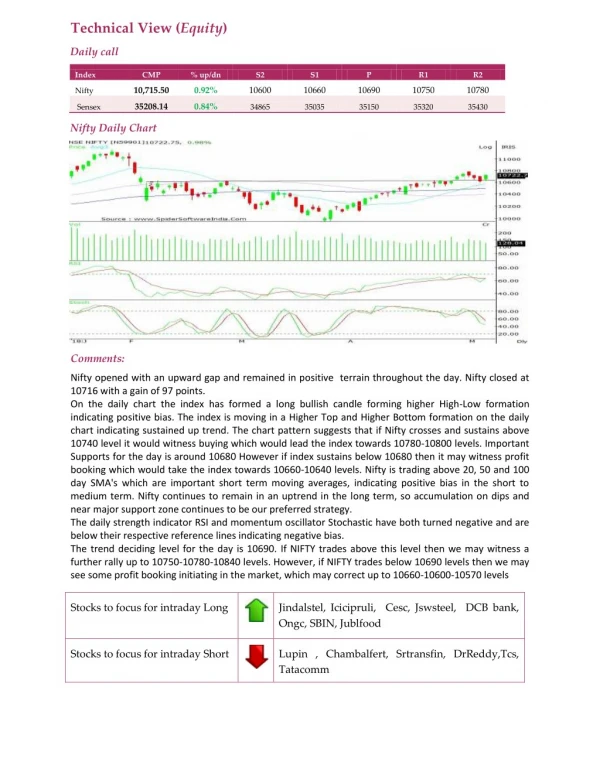
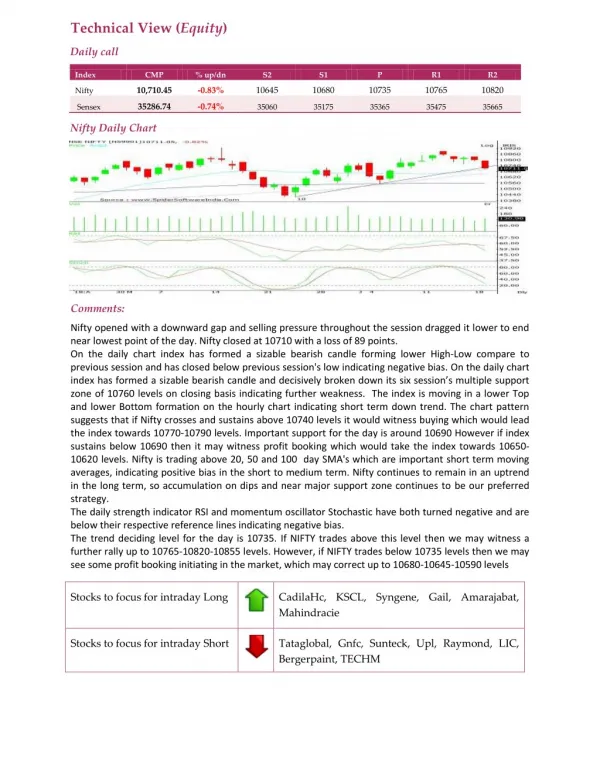
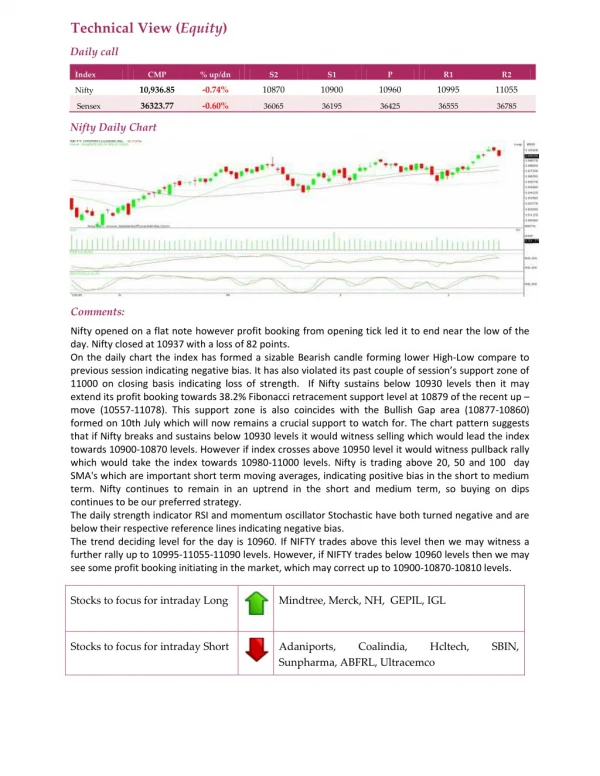
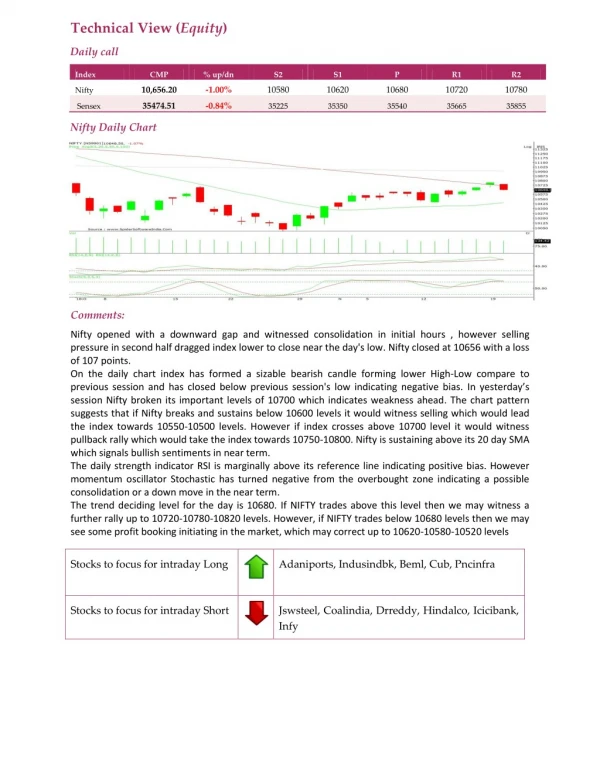
Technical View (Equity) Daily call Index CMP % up/dn S2 S1 P R1 R2 10,656.20 -1.00% 10580 10620 10680 10720 10780 Nifty 35474.51 -0.84% Sensex 35225 35350 35540 35665 35855 Nifty Daily Chart Comments: Nifty opened with a downward gap and witnessed consolidation in initial hours , however selling pressure in second half dragged index lower to close near the day's low. Nifty closed at 10656 with a loss of 107 points. On the daily chart index has formed a sizable bearish candle forming lower High-Low compare to previous session and has closed below previous session's low indicating negative bias. In yesterday’s session Nifty broken its important levels of 10700 which indicates weakness ahead. The chart pattern suggests that if Nifty breaks and sustains below 10600 levels it would witness selling which would lead the index towards 10550-10500 levels. However if index crosses above 10700 level it would witness pullback rally which would take the index towards 10750-10800. Nifty is sustaining above its 20 day SMA which signals bullish sentiments in near term. The daily strength indicator RSI is marginally above its reference line indicating positive bias. However momentum oscillator Stochastic has turned negative from the overbought zone indicating a possible consolidation or a down move in the near term. The trend deciding level for the day is 10680. If NIFTY trades above this level then we may witness a further rally up to 10720-10780-10820 levels. However, if NIFTY trades below 10680 levels then we may see some profit booking initiating in the market, which may correct up to 10620-10580-10520 levels Stocks to focus for intraday Long Adaniports, Indusindbk, Beml, Cub, Pncinfra Stocks to focus for intraday Short Jswsteel, Coalindia, Drreddy, Hindalco, Icicibank, Infy