Download
1 / 1
10 likes | 35 Vues
Axis Direct presents daily derivatives report presenting recommendations based on technical analysis. For trading in derivatives visit https://simplehai.axisdirect.in/offerings/products/derivatives

E N D
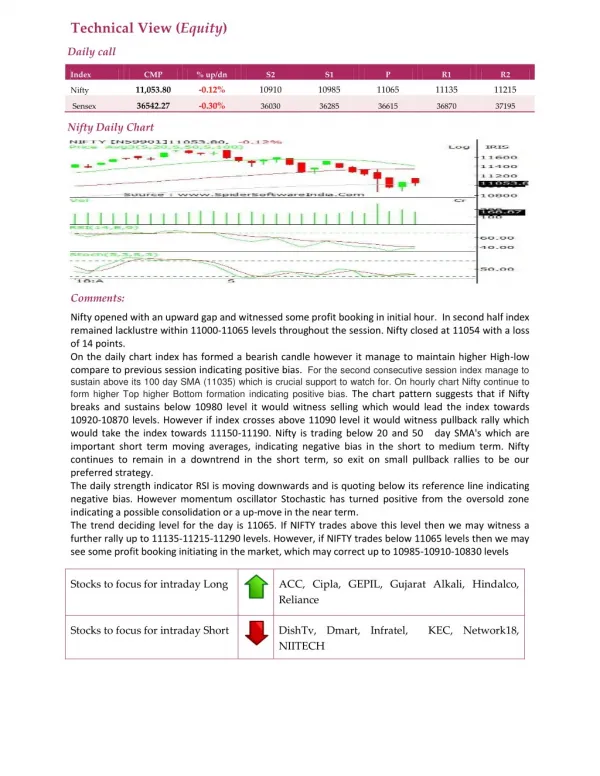
Technical View (Equity) Daily call Index CMP % up/dn S2 S1 P R1 R2 11,053.80 -0.12% 10910 10985 11065 11135 11215 Nifty 36542.27 -0.30% Sensex 36030 36285 36615 36870 37195 Nifty Daily Chart Comments: Nifty opened with an upward gap and witnessed some profit booking in initial hour. In second half index remained lacklustre within 11000-11065 levels throughout the session. Nifty closed at 11054 with a loss of 14 points. On the daily chart index has formed a bearish candle however it manage to maintain higher High-low compare to previous session indicating positive bias. For the second consecutive session index manage to sustain above its 100 day SMA (11035) which is crucial support to watch for. On hourly chart Nifty continue to form higher Top higher Bottom formation indicating positive bias. The chart pattern suggests that if Nifty breaks and sustains below 10980 level it would witness selling which would lead the index towards 10920-10870 levels. However if index crosses above 11090 level it would witness pullback rally which would take the index towards 11150-11190. Nifty is trading below 20 and 50 day SMA's which are important short term moving averages, indicating negative bias in the short to medium term. Nifty continues to remain in a downtrend in the short term, so exit on small pullback rallies to be our preferred strategy. The daily strength indicator RSI is moving downwards and is quoting below its reference line indicating negative bias. However momentum oscillator Stochastic has turned positive from the oversold zone indicating a possible consolidation or a up-move in the near term. The trend deciding level for the day is 11065. If NIFTY trades above this level then we may witness a further rally up to 11135-11215-11290 levels. However, if NIFTY trades below 11065 levels then we may see some profit booking initiating in the market, which may correct up to 10985-10910-10830 levels Stocks to focus for intraday Long ACC, Cipla, GEPIL, Gujarat Alkali, Hindalco, Reliance Stocks to focus for intraday Short DishTv, Dmart, Infratel, KEC, Network18, NIITECH