Daily Technical Report:28 August 2018
10 likes | 32 Vues
Axis Direct presents daily derivatives report presenting recommendations based on technical analysis. For trading in derivatives visit https://simplehai.axisdirect.in/offerings/products/derivatives<br>https://simplehai.axisdirect.in/share-stock-prices/nse/Tech-Mahindra-Ltd-17215<br>https://simplehai.axisdirect.in/share-stock-prices/nse/Sun-Pharmaceuticals-Industries-Ltd-4325<br><br><br>

Daily Technical Report:28 August 2018
E N D
Presentation Transcript
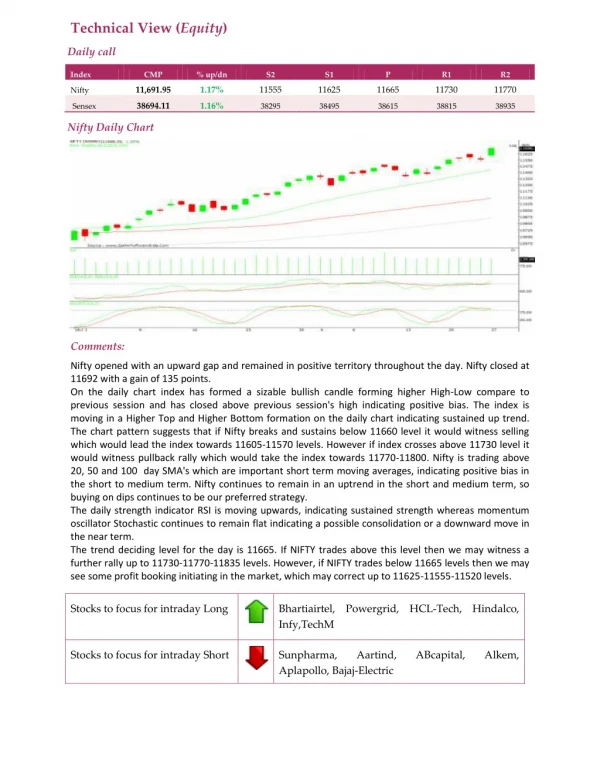
Technical View (Equity) Daily call Index CMP % up/dn S2 S1 P R1 R2 11,691.95 1.17% 11555 11625 11665 11730 11770 Nifty 38694.11 1.16% Sensex 38295 38495 38615 38815 38935 Nifty Daily Chart Comments: Nifty opened with an upward gap and remained in positive territory throughout the day. Nifty closed at 11692 with a gain of 135 points. On the daily chart index has formed a sizable bullish candle forming higher High-Low compare to previous session and has closed above previous session's high indicating positive bias. The index is moving in a Higher Top and Higher Bottom formation on the daily chart indicating sustained up trend. The chart pattern suggests that if Nifty breaks and sustains below 11660 level it would witness selling which would lead the index towards 11605-11570 levels. However if index crosses above 11730 level it would witness pullback rally which would take the index towards 11770-11800. Nifty is trading above 20, 50 and 100 day SMA's which are important short term moving averages, indicating positive bias in the short to medium term. Nifty continues to remain in an uptrend in the short and medium term, so buying on dips continues to be our preferred strategy. The daily strength indicator RSI is moving upwards, indicating sustained strength whereas momentum oscillator Stochastic continues to remain flat indicating a possible consolidation or a downward move in the near term. The trend deciding level for the day is 11665. If NIFTY trades above this level then we may witness a further rally up to 11730-11770-11835 levels. However, if NIFTY trades below 11665 levels then we may see some profit booking initiating in the market, which may correct up to 11625-11555-11520 levels. Stocks to focus for intraday Long Bhartiairtel, Powergrid, HCL-Tech, Hindalco, Infy,TechM Stocks to focus for intraday Short Sunpharma, Aplapollo, Bajaj-Electric Aartind, ABcapital, Alkem,