Weekly Technical Report :17 December 2018
10 likes | 24 Vues
Axis Direct presents daily derivatives report presenting recommendations based on technical analysis. For trading in derivatives visit https://simplehai.axisdirect.in/offerings/products/derivatives<br>https://simplehai.axisdirect.in/share-stock-prices/nse/Bharat-Petroleum-Corporation-Ltd-2290<br>https://simplehai.axisdirect.in/share-stock-prices/nse/Coal-India-Ltd-12019<br>https://simplehai.axisdirect.in/share-stock-prices/nse/NTPC-Ltd-12001<br>https://simplehai.axisdirect.in/share-stock-prices/nse/Cipla-Ltd-114

Weekly Technical Report :17 December 2018
E N D
Presentation Transcript
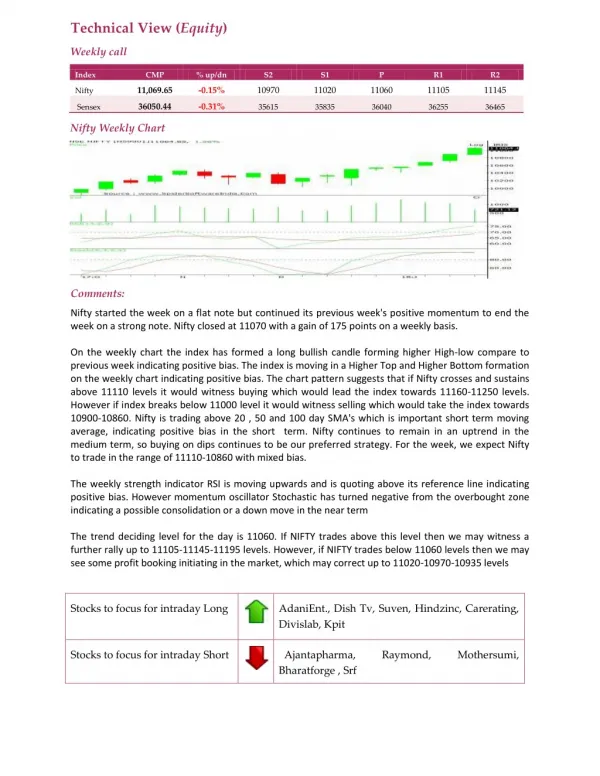
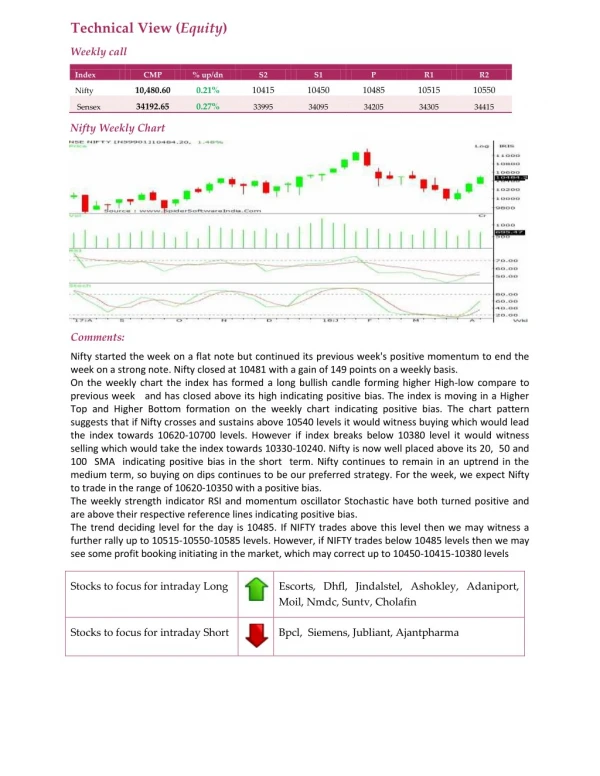
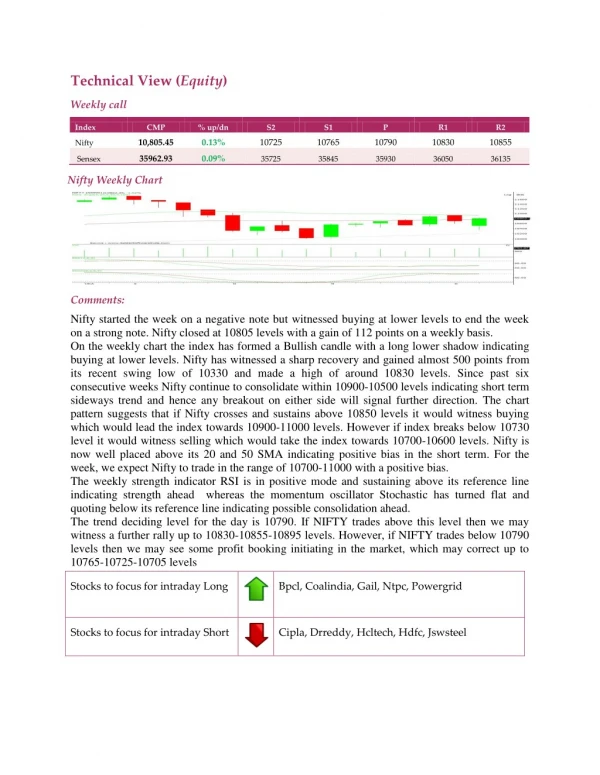
Technical View (Equity) Weekly call Index CMP % up/dn S2 S1 P R1 R2 10,805.45 0.13% 10725 10765 10790 10830 10855 Nifty 35962.93 0.09% Sensex 35725 35845 35930 36050 36135 Nifty Weekly Chart Comments: Nifty started the week on a negative note but witnessed buying at lower levels to end the week on a strong note. Nifty closed at 10805 levels with a gain of 112 points on a weekly basis. On the weekly chart the index has formed a Bullish candle with a long lower shadow indicating buying at lower levels. Nifty has witnessed a sharp recovery and gained almost 500 points from its recent swing low of 10330 and made a high of around 10830 levels. Since past six consecutive weeks Nifty continue to consolidate within 10900-10500 levels indicating short term sideways trend and hence any breakout on either side will signal further direction. The chart pattern suggests that if Nifty crosses and sustains above 10850 levels it would witness buying which would lead the index towards 10900-11000 levels. However if index breaks below 10730 level it would witness selling which would take the index towards 10700-10600 levels. Nifty is now well placed above its 20 and 50 SMA indicating positive bias in the short term. For the week, we expect Nifty to trade in the range of 10700-11000 with a positive bias. The weekly strength indicator RSI is in positive mode and sustaining above its reference line indicating strength ahead whereas the momentum oscillator Stochastic has turned flat and quoting below its reference line indicating possible consolidation ahead. The trend deciding level for the day is 10790. If NIFTY trades above this level then we may witness a further rally up to 10830-10855-10895 levels. However, if NIFTY trades below 10790 levels then we may see some profit booking initiating in the market, which may correct up to 10765-10725-10705 levels Stocks to focus for intraday Long Bpcl, Coalindia, Gail, Ntpc, Powergrid Stocks to focus for intraday Short Cipla, Drreddy, Hcltech, Hdfc, Jswsteel