Weekly Technical Report :19 November 2018
10 likes | 24 Vues
Axis Direct presents daily derivatives report presenting recommendations based on technical analysis. For trading in derivatives visit https://simplehai.axisdirect.in/offerings/products/derivatives<br>https://simplehai.axisdirect.in/share-stock-prices/nse/HDFC-Bank-Ltd-4987<br>https://simplehai.axisdirect.in/share-stock-prices/nse/Delta-Corp-Ltd-17211<br>

Weekly Technical Report :19 November 2018
E N D
Presentation Transcript
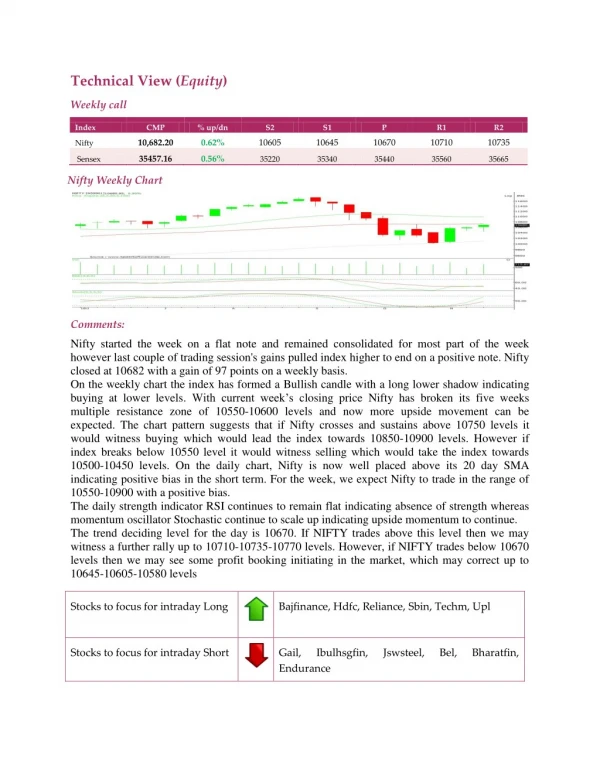
Technical View (Equity) Weekly call Index CMP % up/dn S2 S1 P R1 R2 10,682.20 0.62% 10605 10645 10670 10710 10735 Nifty 35457.16 0.56% Sensex 35220 35340 35440 35560 35665 Nifty Weekly Chart Comments: Nifty started the week on a flat note and remained consolidated for most part of the week however last couple of trading session's gains pulled index higher to end on a positive note. Nifty closed at 10682 with a gain of 97 points on a weekly basis. On the weekly chart the index has formed a Bullish candle with a long lower shadow indicating buying at lower levels. With current week’s closing price Nifty has broken its five weeks multiple resistance zone of 10550-10600 levels and now more upside movement can be expected. The chart pattern suggests that if Nifty crosses and sustains above 10750 levels it would witness buying which would lead the index towards 10850-10900 levels. However if index breaks below 10550 level it would witness selling which would take the index towards 10500-10450 levels. On the daily chart, Nifty is now well placed above its 20 day SMA indicating positive bias in the short term. For the week, we expect Nifty to trade in the range of 10550-10900 with a positive bias. The daily strength indicator RSI continues to remain flat indicating absence of strength whereas momentum oscillator Stochastic continue to scale up indicating upside momentum to continue. The trend deciding level for the day is 10670. If NIFTY trades above this level then we may witness a further rally up to 10710-10735-10770 levels. However, if NIFTY trades below 10670 levels then we may see some profit booking initiating in the market, which may correct up to 10645-10605-10580 levels Stocks to focus for intraday Long Bajfinance, Hdfc, Reliance, Sbin, Techm, Upl Stocks to focus for intraday Short Gail, Endurance Ibulhsgfin, Jswsteel, Bel, Bharatfin,