Download
1 / 1
10 likes | 31 Vues
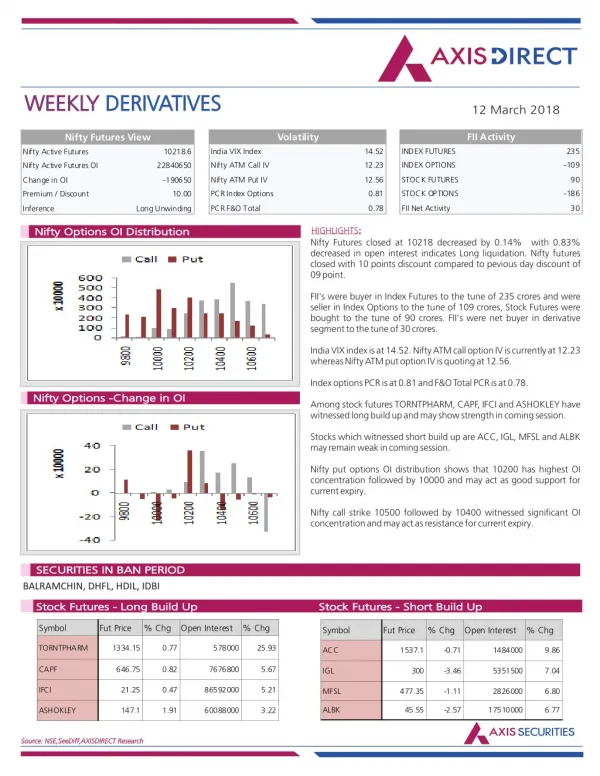
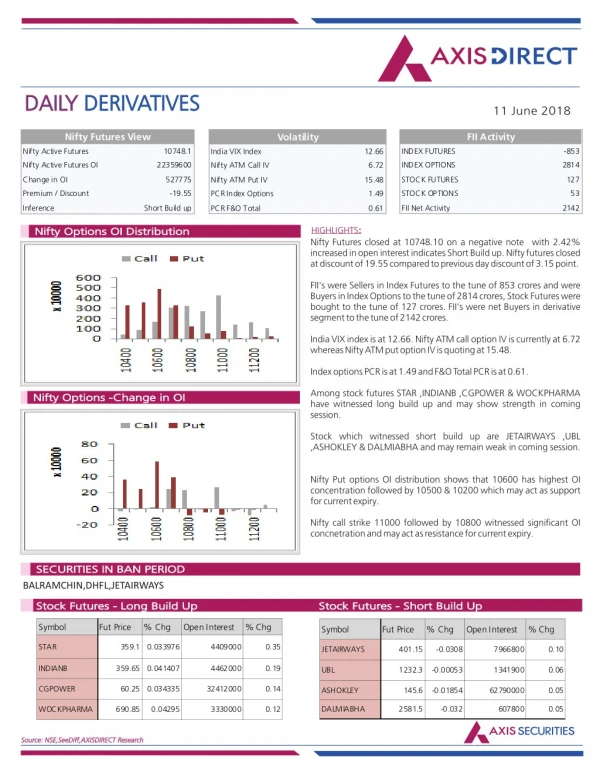
Axis Direct presents daily derivatives report presenting recommendations based on technical analysis. For trading in derivatives visit https://simplehai.axisdirect.in/offerings/products/derivatives<br>https://simplehai.axisdirect.in/share-stock-prices/nse/Tech-Mahindra-Ltd-17215<br>https://simplehai.axisdirect.in/share-stock-prices/nse/Housing-Development-Finance-Corporation-Ltd-230

E N D
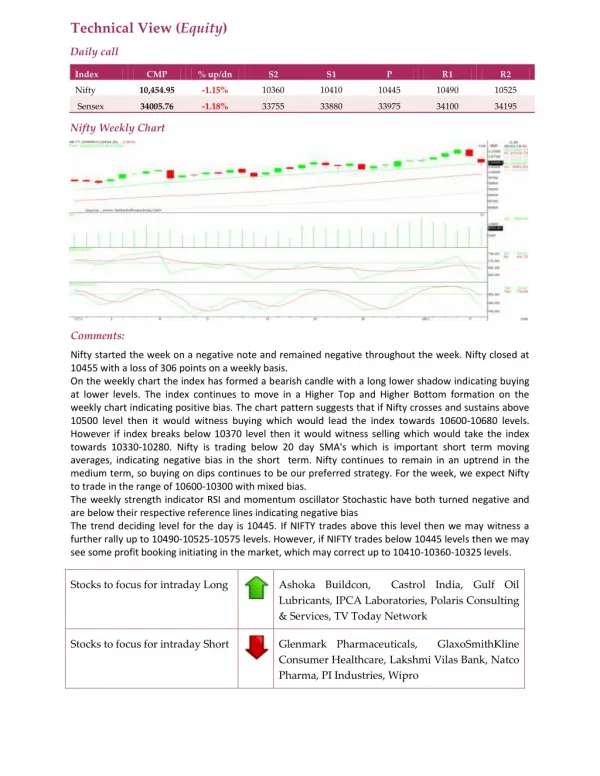
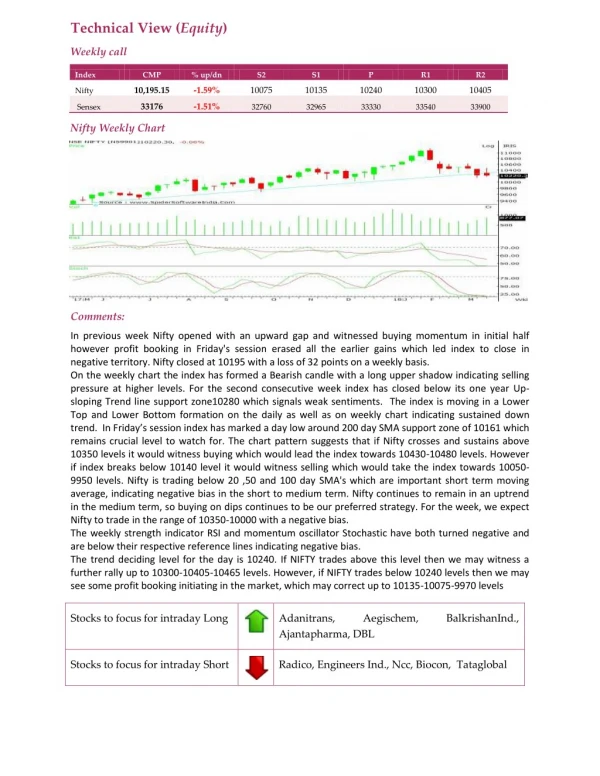
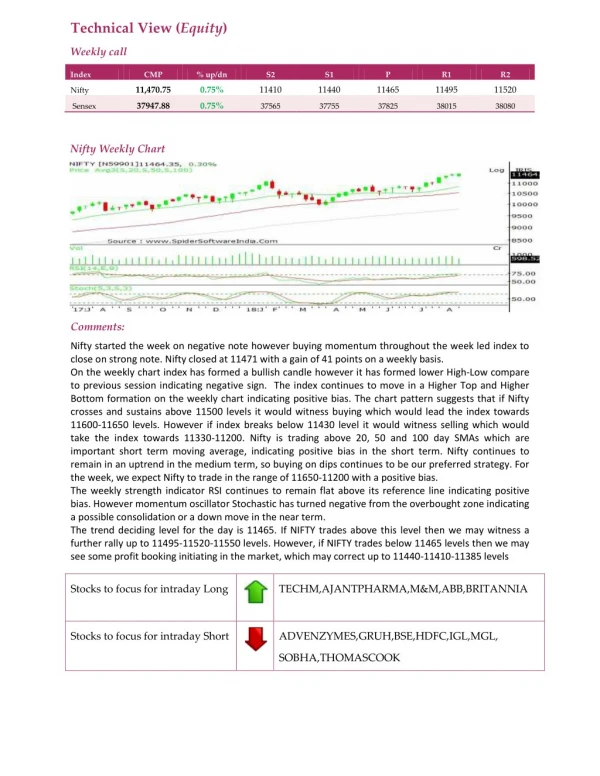
Technical View (Equity) Weekly call Index CMP % up/dn S2 S1 P R1 R2 11,470.75 0.75% 11410 11440 11465 11495 11520 Nifty 37947.88 0.75% Sensex 37565 37755 37825 38015 38080 Nifty Weekly Chart Comments: Nifty started the week on negative note however buying momentum throughout the week led index to close on strong note. Nifty closed at 11471 with a gain of 41 points on a weekly basis. On the weekly chart index has formed a bullish candle however it has formed lower High-Low compare to previous session indicating negative sign. The index continues to move in a Higher Top and Higher Bottom formation on the weekly chart indicating positive bias. The chart pattern suggests that if Nifty crosses and sustains above 11500 levels it would witness buying which would lead the index towards 11600-11650 levels. However if index breaks below 11430 level it would witness selling which would take the index towards 11330-11200. Nifty is trading above 20, 50 and 100 day SMAs which are important short term moving average, indicating positive bias in the short term. Nifty continues to remain in an uptrend in the medium term, so buying on dips continues to be our preferred strategy. For the week, we expect Nifty to trade in the range of 11650-11200 with a positive bias. The weekly strength indicator RSI continues to remain flat above its reference line indicating positive bias. However momentum oscillator Stochastic has turned negative from the overbought zone indicating a possible consolidation or a down move in the near term. The trend deciding level for the day is 11465. If NIFTY trades above this level then we may witness a further rally up to 11495-11520-11550 levels. However, if NIFTY trades below 11465 levels then we may see some profit booking initiating in the market, which may correct up to 11440-11410-11385 levels Stocks to focus for intraday Long TECHM,AJANTPHARMA,M&M,ABB,BRITANNIA Stocks to focus for intraday Short ADVENZYMES,GRUH,BSE,HDFC,IGL,MGL, SOBHA,THOMASCOOK