Weekly Technical Report :22 January 2018
10 likes | 44 Vues
Axis Direct presents daily derivatives report presenting recommendations based on technical analysis. For trading in derivatives visit https://simplehai.axisdirect.in/offerings/products/derivatives<br>

Weekly Technical Report :22 January 2018
E N D
Presentation Transcript
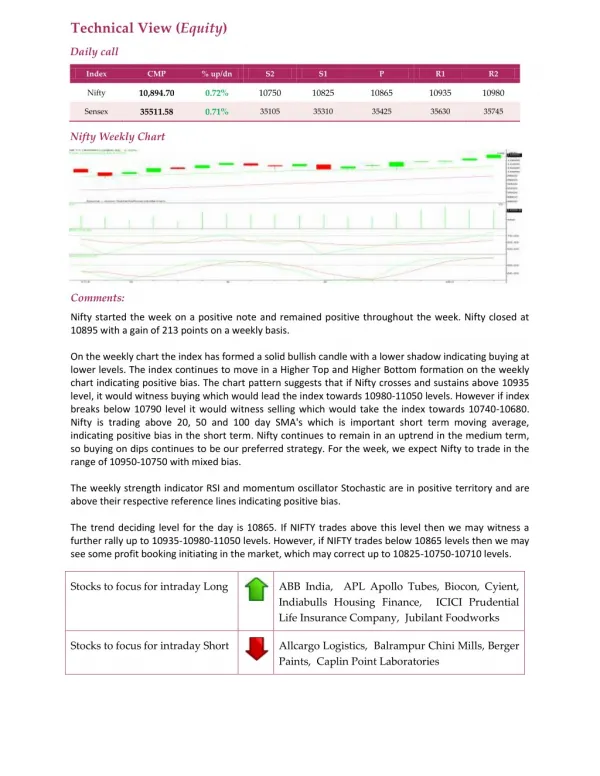
Technical View (Equity) Daily call Index CMP % up/dn S2 S1 P R1 R2 10,894.70 0.72% 10750 10825 10865 10935 10980 Nifty 35511.58 0.71% Sensex 35105 35310 35425 35630 35745 Nifty Weekly Chart Comments: Nifty started the week on a positive note and remained positive throughout the week. Nifty closed at 10895 with a gain of 213 points on a weekly basis. On the weekly chart the index has formed a solid bullish candle with a lower shadow indicating buying at lower levels. The index continues to move in a Higher Top and Higher Bottom formation on the weekly chart indicating positive bias. The chart pattern suggests that if Nifty crosses and sustains above 10935 level, it would witness buying which would lead the index towards 10980-11050 levels. However if index breaks below 10790 level it would witness selling which would take the index towards 10740-10680. Nifty is trading above 20, 50 and 100 day SMA's which is important short term moving average, indicating positive bias in the short term. Nifty continues to remain in an uptrend in the medium term, so buying on dips continues to be our preferred strategy. For the week, we expect Nifty to trade in the range of 10950-10750 with mixed bias. The weekly strength indicator RSI and momentum oscillator Stochastic are in positive territory and are above their respective reference lines indicating positive bias. The trend deciding level for the day is 10865. If NIFTY trades above this level then we may witness a further rally up to 10935-10980-11050 levels. However, if NIFTY trades below 10865 levels then we may see some profit booking initiating in the market, which may correct up to 10825-10750-10710 levels. ABB India, APL Apollo Tubes, Biocon, Cyient, Indiabulls Housing Finance, ICICI Prudential Life Insurance Company, Jubilant Foodworks Stocks to focus for intraday Long Allcargo Logistics, Balrampur Chini Mills,Berger Paints, Caplin Point Laboratories Stocks to focus for intraday Short