Weekly Technical Report :23 July 2018
10 likes | 33 Vues
Axis Direct presents daily derivatives report presenting recommendations based on technical analysis. For trading in derivatives visit https://simplehai.axisdirect.in/offerings/products/derivatives<br>https://simplehai.axisdirect.in/share-stock-prices/nse/ITC-Ltd-301<br>https://simplehai.axisdirect.in/share-stock-prices/nse/Sun-Pharmaceuticals-Industries-Ltd-4325<br>https://simplehai.axisdirect.in/share-stock-prices/nse/Tech-Mahindra-Ltd-17215<br>https://simplehai.axisdirect.in/share-stock-prices/nse/Wipro-Ltd-614<br>

Weekly Technical Report :23 July 2018
E N D
Presentation Transcript
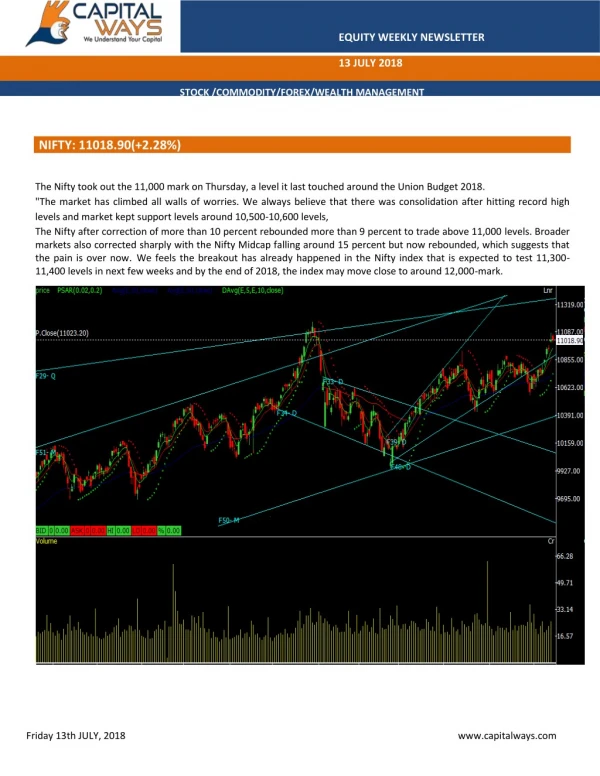
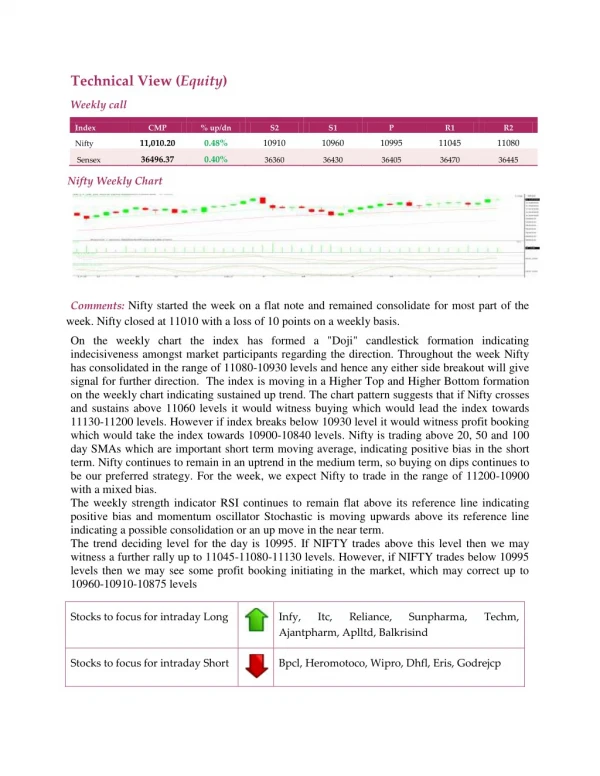
Technical View (Equity) Weekly call Index CMP % up/dn S2 S1 P R1 R2 11,010.20 0.48% 10910 10960 10995 11045 11080 Nifty 36496.37 0.40% Sensex 36360 36430 36405 36470 36445 Nifty Weekly Chart Comments: Nifty started the week on a flat note and remained consolidate for most part of the week. Nifty closed at 11010 with a loss of 10 points on a weekly basis. On the weekly chart the index has formed a "Doji" candlestick formation indicating indecisiveness amongst market participants regarding the direction. Throughout the week Nifty has consolidated in the range of 11080-10930 levels and hence any either side breakout will give signal for further direction. The index is moving in a Higher Top and Higher Bottom formation on the weekly chart indicating sustained up trend. The chart pattern suggests that if Nifty crosses and sustains above 11060 levels it would witness buying which would lead the index towards 11130-11200 levels. However if index breaks below 10930 level it would witness profit booking which would take the index towards 10900-10840 levels. Nifty is trading above 20, 50 and 100 day SMAs which are important short term moving average, indicating positive bias in the short term. Nifty continues to remain in an uptrend in the medium term, so buying on dips continues to be our preferred strategy. For the week, we expect Nifty to trade in the range of 11200-10900 with a mixed bias. The weekly strength indicator RSI continues to remain flat above its reference line indicating positive bias and momentum oscillator Stochastic is moving upwards above its reference line indicating a possible consolidation or an up move in the near term. The trend deciding level for the day is 10995. If NIFTY trades above this level then we may witness a further rally up to 11045-11080-11130 levels. However, if NIFTY trades below 10995 levels then we may see some profit booking initiating in the market, which may correct up to 10960-10910-10875 levels Stocks to focus for intraday Long Infy, Ajantpharm, Aplltd, Balkrisind Itc, Reliance, Sunpharma, Techm, Stocks to focus for intraday Short Bpcl, Heromotoco, Wipro, Dhfl, Eris, Godrejcp