Download
1 / 44
450 likes | 1.39k Vues
Satish Pradhan Dnyanasadhana College, Thane. Department of Chemistry S.Y.B.Sc. Analytical Chemistry Paper-I Sem-IV UV-Visible spectroscopy Dr.G.R.Bhagure.

E N D
SatishPradhan Dnyanasadhana College, Thane.Department of ChemistryS.Y.B.Sc. Analytical ChemistryPaper-I Sem-IVUV-Visible spectroscopyDr.G.R.Bhagure
3.1.1 Errors in Chemical analysis: Types of errors-Determinate and Indeterminate errors-Constant and Proportionate errors, Absolute and Relative error-Minimization of errors • 3.1.2 Measures of central tendency and dispersion : • Measures of central tendency-Mean, Median, Mode. • Measures of dispersion- Deviation, Average deviation, Relative average deviation ,Range , Standard deviation, Variance, Correlation coefficient and Relative standard deviation (Numerical problems expected) • 3.1.3Performance Characteristics of an Analytical method: Accuracy, Precision, Sensitivity, Specificity, Selectivity, Robustness, Ruggedness, Linearity range, Limit of quantification, Limit of Detection, Signal to Noise ratio. • 3.2 TITRIMETRIC ANALYSIS-IV (3L) • Precipitation titrations • Argentimetric titrations, Construction of titration curves, Volhard”s method, Mohr’s method, Adsorption indicators- theory and applications
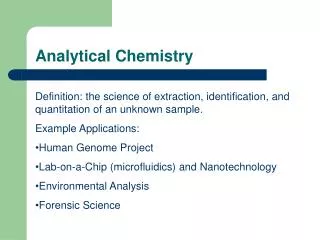
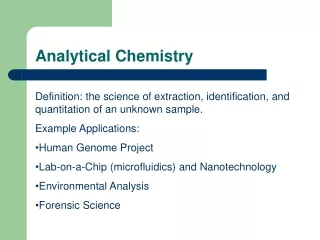
Spectroscopy is branch of Analytical Chemistry which deals with study of interaction of electromagnetic radiation with matter. • In Ultra Violet and Visible Spectroscopy absorption of light is measured in the wavelength region from 200 nm to 800 nm.
The instrument used in Ultra violet and visible region (from 200 nm to 800 nm) is called as spectrophotometer. • The instrument used for measurement of absorption of light in visible region (from 400 nm to 800 nm) is called as colorimeter or photometer.
Quantum theory of Radiation Black Body White Body
Energy for Atom and Molecule Atom Electronic Energy Electronic Energy Atom Atom Rotational Energy Vibrational Energy
Rotational Energy CH3----------------- CH3 Motion of molecule from the centre of joining the nuclei
Vibrational Energy Bond length 154 pm, Stretching 10 pm. For a C-C bond with a bond length of 154 pm, the variation is about 10 pm.
Vibrational Energy C C 10 pm Bending 4o C For C-C-C bond angle a change of 4o is typical. This moves a carbon atom about 10 pm.
Laws of Absorption • Lamberts Law: (1760) • When monochromatic light is allow to pass trough a transparent medium, the rate of decrease of intensity of incident light with the thickness of the absorbing medium is directly proportional to intensity of incident light. OR • Equal fractions of the incident radiation are absorbed by successive layers of equal thickness containing the same no .of absorbing species
Laws of Absorption • Beers Law: (1760) • When monochromatic light is allow to pass through a solution, the rate of decrease of intensity of incident light with the concentration of solution is directly proportional to intensity of incident light. OR • Equal fractions of the incident radiation are absorbed by successive layers of solution containing the same no .of absorbing species
Radiation absorbed is directly proportional to distance covered by light I2 Io As per lamberts law
Deviation from Beer-Lambert’s Law • According to Beers Lamberts Law • A= € x lx C OR A= log10Io/It • Where: • A= Absorbance • € = Molar absorbance • l= Path length in cm. • C= Concentration in Mole/L • According to the above equation • Absorbance is directly proportional to concentration
A is Directly proportional to concentration • Absorbance-- Concentration-----------
Beers Lamberts Law verified Positive Deviation • Absorbance-- Negative Devitation Concentration-----------
1) Real Deviation:- • Concentration should be below 0.01M • At higher concentration average distance between molecule decreases which affect in absorbance. • Molar absorptivity changes because at higher concentration refractive index of solution changes High Concentrated Low concentrated
2) Chemical Deviation:- • This deviation occurs when solute present in solution undergoes association, dissociation or ionization. • Association: Diluting or concentrating the solution of Benzyl alcohol in chloroform undergoes polymerization. • 4C6H5CH2OH---->(C6H5CH2OH)4 • Dissociation:-Ex. K2Cr207 • Cr2072- + H20 2HCrO42H+ +2CrO42- (Orange) (Yellow)
3)Instrumentatal Deviation • The law is valid If light used is strictly monochromatic. If not deviation may occur. • Deviation may occur if width of slit is not proper which may allow undesired radiation to pass through it. MCL PCL
INSTRUMENTATIONS • The various components of instruments and type of instruments used is called as Instrumentation. • Instrument used in visible region (400 to 800 nm) is called as colorimeter or photometer • Instrument used in Ultra violet & visible region (200 to 800 nm) is called as Spectrophotometer. • The basic component of the instruments are • Radiation Source (Tungsten Filament lamp/ hydrogen or deuterium lamp) • Wave length selector( Filter/ monochromator) • Sample cell • Detector
PHOTO CELL DETECTOR Detectors:- PHOTO MULTIPLIER TUBE PHOTOTUBES
PHOTOCELL DETECTOR (--) D D G C E- G B A + Iron plate A Semiconductor Selenium B Thin layer of silver C
Construction: It consists of Iron plate A on which a thin layer of a semiconductor like Selenium B is deposited. The layer is covered by very thin layer of silver C that acts as collector electrode. A ring D can hold the silver plate in its place. • Working:-This cell operates without battery. When the transmitted beam of light passes through thin film of silver metal to selenium layer, electrons released from semiconductor surface .These electrons pass through a hypothetical barrier layer in between silver and selenium layer and are collected by silver electrode. • Thus under the action of light a cell is formed with iron plate as positive electrode • Metal ring as negative electrode. The current flow is detected in galvanometer. This current is directly proportional to absorbance.
PHOTO TUBE DETECTOR Photo Cathode (-) Collector Anode (+) - AMPLIFIER RECORDER
Single Beam Photometer Radiation Source Collimating Lens Filter Sample Cell Photocell Read Out Device
Working of Single Beam photometer • Quantitative analysis can be performed by calibration curve method. • Instrument is adjusted to 0 absorbance or 100% transmittance by Using Blank Solvent at a particular wavelength. • The absorbance of sample solution as well as standard solution are measured.
Distinguish Between Photometer and Spectrophotometer • SPECTROPHOTOMETER. • Radiation source is Hydrogen or deuterium lamp. • Absorbance of light is measured in the wavelength 200--800 nm. (U.V.& Visible region) • Prism or Gratings are used to select monochromatic light. • Sample cells made from quartz. • Detectors used are photomultiplier tube. • Absorbance of coloured as well as colorless solution can be measured • PHOTOMETER • Radiation source is Tungsten filament lamp. • Absorbance of light is measured in the wavelength 400-800 nm.( Visible region) • Filters are used to select monochromatic light. • Sample cells made from glass. • Detectors used are photocell or photoemmisive tube. • Absorbance of coloured solution is measured
Filter: A filter transmits the monochromatic beam of light and absorbs other light Filter Polychromatic light Monochromatic light
FOCUSING LENS COLLIMATING LENS LAMBDA-1 LAMBDA-2 PRISM ENTRANCE SLIT EXIT SLIT PRISM MONOCHROMATOR
MAGINIFIED VIEW ENLARGED VIEW GRATING MONOCHROMATOR
Applications of U.V. & Visible Spectroscopy • Qualitative Analysis • Identification of Structural Groups in Molecules. • Spectroscopic analysis of a substance is carried out using radiation of a particular wavelength this wave length is called as Lambda Max. The Constituent groups in a molecule absorbed to their characteristic wavelengths. • It is possible to determine a particular group in a molecule by determining its Lambda Max. Lambda Max values of important groups are given in following table.
The Wavelength at which absorbance of highly concentrated solution is maximum is called as Lambda max. A B S O B A N C E Lambda Max 200 300 400 500 600 700 800 Wavelength ---
Applications of U.V. & Visible Spectroscopy Quantitative Analysis By Calibration Curve Method
Other Applications • UV and visible spectroscopy can be used up to concentrations up to 10-6 and some times up to 10-7 M. • Qualitative analysis can be performed because each absorbing species absorb at different wave length. • It used in water and air pollution studies. • It is also used to study the complexes and in the determination of complex. • It is used in industry to monitor various process controls. • It is also used to study to distinguish between cis-and trans isomerism. C- is isomer absorbs at shorter wave length and trans isomer absorb at longer wave length.