Download
1 / 34
340 likes | 501 Vues
Managing Risk and Seizing Opportunity in 2012 and Beyond. Dr. Marin Bozic Nebraska State Dairy Association│ March 13, 2012. Topics for today. Recent events in the dairy markets Risk factors in 2012 Hedging margin risk Long-run risk management. June 2012 Class III Futures.

E N D
Managing Risk and Seizing Opportunity in 2012 and Beyond Dr. Marin Bozic Nebraska State Dairy Association│ March 13, 2012
Topics for today • Recent events in the dairy markets • Risk factors in 2012 • Hedging margin risk • Long-run risk management
June 2012 Class III FuturesComponents contribution to decline
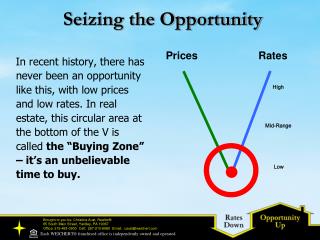
Term structure of futures prices Based on options data, there is 20% chance Class III price will settle below the shaded area, and 20% it will settle higher.
Risk factors • U.S. recovery to stop? • Eurozone collapse? • War with Iran? • Runaway inflation? • Three year cycles? (2009 + 3 = 2012)
Implied Probabilities of Uncertain Events:1. U.S. Economic Recovery
Implied Probabilities of Uncertain Events:2. Dropping out of Euro zone
Can we make use of prediction markets in dairy? Information discovery: • E-verify to become mandatory before 12/31/2012 • Farm bill to pass before 9/30/2012 Risk transfer: • “The Secretary of Agriculture to announce that the stabilization program is in effect for June 2012”
Historical Milk-Feed Margin 2010-2011 Source: Katie Krupa, Rice Dairy, LLC.
Forward Margins Source: http://dairymgt.info/netgiofc/
Rice Dairy Milk-Feed Margin Formula 1 cwt of milk - 0.80575 bu of corn - 0.0087 ton of SBM 2/8/2012 Source: Katie Krupa, Rice Dairy, LLC.
Rice Dairy Milk-Feed Margin Formula 1 cwt of milk - 0.80575 bu of corn - 0.0087 ton of SBM 3/12/2012 Source: Katie Krupa, Rice Dairy, LLC.
Historical Perspective Source: Katie Krupa, Rice Dairy, LLC.
Historical Perspective Source: Katie Krupa, Rice Dairy, LLC.
Hedging by any other name… There are (at least) three very different way dairymen can manage risk: • Contracting – i.e. futures and options, forward pricing through the coop, cash contracts for feed • Strong equity/fast growth – increasing efficiency to keep costs below national average, possibly by attracting investors to keep debt/equity ratio low in face of fast expansion • Dairying as a hedge – low cash-flow costs, but high opportunity costs of feed. Dairying as a hedge against lower future value of land/crops
Short run (wish there was a fifth udder) Price S D′ D Quantity
Long run (eight udders are better than four) Price S D′ D Quantity
What does the long run U.S. milk supply look like? Data period: 1980-2010
Percent of U.S. Milk Production by Large Dairy Farms Percent of US milk production by farms with 2000+ cows grows on average by 2.2% a year.
Flat supply curve – what are the implications? In the long run… • Dairy Darwinism: dairyman to businessman, or out of business. • Demand-enhancing activities boost quantity, not price (think exports, check-off, product research & development) • Increase in price of one milk fraction decreases the price of another (think whey vs. cheese) until returns to dairying revert to average • Uncertainty = higher average returns • Vertical integration as the 21st century version of “cooperative revolution”
Managing Risk and Seizing Opportunity in 2012 and Beyond presented at the I-29 Dairy Conference Sioux Falls, February 8, 2011 Dr. Marin Bozic mbozic@umn.edu Department of Applied Economics University of Minnesota-Twin Cities 317c Ruttan Hall 1994 Buford Avenue St Paul, MN 55108 You may download this presentation at http://marinbozic.info/