Download
1 / 24
240 likes | 383 Vues
Tanyard Creek, Lilly Branch and MS4 Locations Water Quality Monitoring University of Georgia. Summary of Data November 2011. Tanyard Creek, Lilly Branch and MS4 Locations Water Quality Monitoring. Introduction and Purpose Description of Monitoring Program Overview of Water Quality Parameters

E N D
Tanyard Creek, Lilly Branch and MS4 LocationsWater Quality MonitoringUniversity of Georgia Summary of Data November 2011
Tanyard Creek, Lilly Branch and MS4 LocationsWater Quality Monitoring • Introduction and Purpose • Description of Monitoring Program • Overview of Water Quality Parameters • Monitoring Results • Recommendations Pond at Recreational Trails Upstream of Location MS4-4C University of Georgia | November 2011
Introduction and Purpose • Baseline data collected in 2003 - 2004 • Yearly monitoring 2005 - 2010 • Evaluated water quality in Tanyard Creek and MS4 locations in support of Athens-Clarke County’s NPDES permit • Sampled during dry and wet conditions Cloverhurst Branch MP-3 Vet Med/Lilly CreekMS4-3 University of Georgia | November 2011
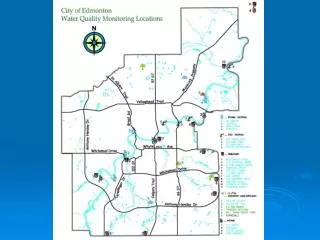
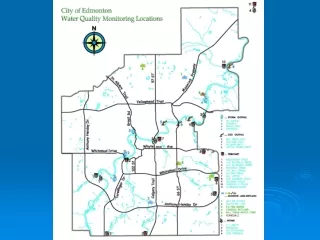
Description of Monitoring Program Tanyard Creek, Lilly Branch and MS4 Sampling Locations 2 sites on Tanyard Creek 1 site on Cloverhurst Branch 7 MS4 sites Added three new locations on Lilly Branch University of Georgia | November 2011
Tanyard Creek and Cloverhurst Branch 1 sq. mile drainage area Drains part of downtown Athens and part of UGA east and north of the stadium Piped until Newton Street Flows through double box culvert under stadium On GA EPD’s 303(d) list as not supporting designated uses for bacteria University of Georgia | November 2011
Parameters and Sampling Frequency for Tanyard Creek and Lilly Branch Locations • 4 quarterly dry events • 4 quarterly wet events • Additional 6 events for bacteria • Lilly Branch – bacteria only at MP-9 and MP-10 • Field parameters: stage, pH, DO, temperature, turbidity, conductivity • Analytical parameters: TSS, fecal coliform, e. coli, VOCs, TP, TN, hardness, metals Tanyard Creek just upstream of stadium culvert Tanyard Creek MP-6 University of Georgia | November 2011
MS4 Locations MS4-2 MS4-7 University of Georgia | November 2011
Central Monitoring locations (Lilly Branch) University of Georgia | November 2011
MS4 Southern Monitoring Locations University of Georgia | November 2011
Parameters and Sampling Frequency for MS4 Locations • 4 quarterly dry events • 4 quarterly wet events • Field parameters: stage, pH, DO, temperature, turbidity, conductivity • Analytical parameters: TSS, fecal coliform, e. coli, VOCs, TP, TN, hardness, metals, oil and grease • MS4-6 and MS4-7 only sampled during wet periods Lake Herrick OutflowMS4-4b Rhizotron Building MS4-8 University of Georgia | November 2011
MP-1 ResultsTanyard Creek, north side of Baxter St • Bacteria (200 cfu/1000 ml May – Oct and 1000 cfu/1000 ml Nov to Apr) • Dry weather higher than wet • All warm weather events exceeded standard • Geomean sampling exceeded standard for cool and warm weather. • Highest concentrations are lower than seen historically. • Overall, improvement in bacteria concentrations. • MP-1 still highest of three Tanyard stations. • Tetrachloroethene (PCE) (standard 3.3 µg/L ) • Detected during each event and historically • Range of BRL to 14 µg/L exceeded standard • Metals • No exceedances during dry events • Lead and copper exceeded standards during wet events • Consistent with historical trends • Nutrients • TP trending down over past several years but still exceeded guidance • TN historically high during dry events. High results typical of historical and not decreasing like TP appears to be. • TSS was similar to historical values • pH is trending low, 3 events below the standard • Conductivity higher than typical during base flow. Looking downstream from culvert Right bank of culvert University of Georgia | November 2011
MP-3 ResultsCloverhurst Branch, south side of Baxter St behind Oglethorpe House • Bacteria (200 cfu/100 ml May – Oct and 1000 cfu/100 ml Nov to Apr) • All warm weather events exceeded standard • E.coli and fecal coliform concentrations similar • Wet events higher than dry events (two wet events of 13,000 and 18,000 higher than measured historically at MP-3) • Location worse than historically with geomean higher than MP-1 for warm weather. • Metals • No exceedances during dry events • Lead and copper exceeded standards during wet events • Arsenic and zinc below standards • Consistent with historical trends • Nutrients • TP trending down slightly but still exceeded guidance • TN historically high during dry events • Results are similar b/t wet and dry but still exceeded guidance • TSS was similar to historical values • Conductivity in line with typical values Looking upstream at right bank Looking downstream from sampling llocation University of Georgia | November 2011
MP-6 ResultsTanyard Creek, downstream of stadium prior to confluence with North Oconee River • Bacteria (200 cfu/100 ml May – Oct and 1000 cfu/100 ml Nov to Apr) • Only warm and not cool weather events exceeded standard (improvement from past years) • E.coli and fecal coliform concentrations similar • Wet events higher than dry events • Overall improvement over historical • Highest single reading (13,000 cfu/100 ml was lower than highest value for past 4 yrs) • Metals • No exceedances during dry events • Lead and copper exceeded standards during wet events • Consistent with historical trends • No trend in downstream direction evident • Nutrients • TP lower than historical but still exceeded guidance. Higher during wet events in past but this year dry weather was higher • TN historically high during dry events (average 4 mg/l – much higher than typical urban stream should be) • Results are similar b/t wet and dry but still exceeded guidance. • MP-6 overall is higher than upstream locations for TP and TN. • TSS was similar to historical values • Conductivity higher than typical during baseflow – source likely from MP-1 since MP-3 is normal. Looking downstream from sampling location Looking upstream at culvert under railroad University of Georgia | November 2011
Tanyard Creek fecal coliform results • 2010-2011 data 2007 – 2008 data 2009-2010 data University of Georgia | November 2011
MS4-2 ResultsOld Physical Plant (Steam Plant) Creek • Bacteria (200 cfu/100 ml May – Oct and 1000 cfu/100 ml Nov to Apr) • Overall improvement from historical, especially from 2009. • 2 out of 8 sampling events exceeded standards • Ranged from 23 to 1,600 cfu • Metals • Site also sampled for nickel and pH (lab). No nickel exceedances. • Copper exceedances during dry events • Copper and lead exceedances during wet events • Exceedances overall relatively small • Nutrients • Improvement from historical to current for TP • Some exceedances, but small • TP overall higher during wet events • Some very high TN concentrations during dry and summer events • TSS was similar to historical values • Oil and Grease detected below reporting limit • pH below the standard for three events (two wet and one dry) – should continue to monitor considering steam plant Culvert just upstream of sampling location Looking downstream from sampling location University of Georgia | November 2011
Lilly Branch MP-8, MP-9 and MP-10 • pH • Overall low and don’t meet state criteria at MP-8 and MP-9. MP-10 and downstream are ok. • Turbidity increases downstream during wet events. Wet weather averages increase from 9.99 at MP-8 to 67.64 at MP-9. Dry weather averages increase as well although not as substantially. • TSS increases downstream during wet and dry events. Average wet at MP-8 was 6.6 mg/l while 30.2 mg/l at MS4-3. • Bacteria • Geomean standard exceeded at each location during warm weather and at MP-8 and MP-10 during cool weather. • Bacteria highest at MP-8, then MP-10 is higher than MP-9 and MS4-3. • MP-8 concentrations highest during dry weather • Highest concentrations measured in the 20,000 cfu/100 mL range. • No VOCs detected • Nutrients • TP higher during wet events and overall increases in the downstream direction. • TN similar for both wet and dry events and overall increases in the downstream direction. Most values exceed guidance level. • Metals • No exceedances during dry events • Lead and copper exceeded standards during wet events • Copper higher at MS4-3 than MP-8 University of Georgia | November 2011
MS4-3 ResultsVet Medicine/a.k.a. Lilly Creek • Bacteria(200 cfu/100 ml May – Oct and 1000 cfu/100 ml Nov to Apr) • 7 out of 8 sampling events exceeded standards (slightly worse than 2009) • Ranged from 160 to 12,000 cfu/100 ml (similar to historical) • Wet events generally higher and higher than previous 2 years’ monitoring • Metals • Copper and lead exceedances during wet events • Exceedances relatively small • Nutrients • Improvement from historical to current sampling • TP overall higher during wet events • Some high TN concentrations during wet events but better than historical • TSS was similar to historical values Looking upstream at road culvert from sampling location Looking downstream from sampling location University of Georgia | November 2011
MS4-4b and MS4-4c ResultsLake Herrick inflow and outflow • Bacteria (200 cfu/100 ml May – Oct and 1000 cfu/100 ml Nov to Apr) • MS4-4b: no events exceeded standard • MS4-4c: 3 out of 8 events over standard • MS4-4c: higher relative to MS4-4b • Average MS4-4c fecal coliform exceeded cold weather standards • Higher during wet events, especially at MS4-4c • Metals - No issues • Nutrients • TP and TN worse than historical to current sampling at MS4-4c • Similar at MS4-4b • Some exceedances for TN but minor • Overall higher TN during wet events • TSS • Dry weather TSS improved from historical. Wet weather recorded some high values (142 mg/l) with average wet of 44 mg/l • TSS was similar to historical values at MS4-4b • DO • Three events below the standard of 4 mg/l • Very low flow, high amounts of iron reducing bacteria • pH • Trending low, average dry event pH under the standard at both locations. MS4-4c had 4 of 8 results below standard. • Turbidity at MS4-4c is higher than in previous years. MS4-4c sampling location Outlet pipe from Lake Herrick MS4-4b University of Georgia | November 2011
MS4-6 and MS4-7 ResultsAutomotive Center on River Road • Only sampled during wet events • Bacteria (200 cfu/1000 ml May – Oct and 1000 cfu/1000 ml Nov to Apr) • Average fecal coliform exceeded standards • 24,000 cfu/100 mL on 3/9/11 (wet event) at MS4-6 (similar to historical measurements) • 10,000 cfu/100 mL on 10/25/10 (wet event) at MS4-7. • Metals • Small exceedances of copper, lead and zinc during wet events at MS4-7 • Nutrients • Wet events higher than historical sampling events • Oil and grease • Below reporting limits except for one event just over • TSS • 123 mg/L on 1/21/2010 (wet event) • Otherwise similar to historical values • Turbidity at MS4-7 higher than in previous years. MS4-7 MS4-6 University of Georgia | November 2011
MS4-8 ResultsRhizotron Building • Bacteria (200 cfu/100 ml May – Oct and 1000 cfu/100 ml Nov to Apr) • 5 out of 8 events exceeded standards (worse than historical) • Ranged from 11to 5,600 cfu/1000 ml (higher than historical) • Both wet and dry events had high concentrations • Metals (Zinc standard is 65 µg/l) • Small exceedances of copper and lead during dry events • Small exceedance of copper during wet events • High zinc during dry and wet events, ranged from 43 to 159 µg/l but significant improvement over historical results • Nutrients • Very high TN and TP during wet and dry events but overall significant improvement for both • TP ranged from 0.1 to 5.72 mg/l • TN ranged from 1.1 to 19.4 mg/l • TSS • Improved over historical but still have levels in the 150 mg/l range during dry events (historically have had values in the 500 mg/l range) • VOCs – none detected, improvement over historical • Turbidity was not elevated during dry weather events in contrast to historical trends. Storage shed just upstream of sampling location MS4-8 sampling location University of Georgia | November 2011
Maintenance Issues at MS4-3 Collapsed headwall Undercut bank and exposed pipe University of Georgia | November 2011
Maintenance Issues at MS4-4C Eroded Gullies Leaking Dam University of Georgia | November 2011
Recommendations • Continue sampling program with similar frequency and locations • Maintain data trend analysis • Document improvements at individual stations • Many exceedances at multiple stations and for multiple parameters • Coordinate with ACC regarding PCE exceedance at MP-1 • Facility good housekeeping measures • Assess outdoor storage practices, fertilizer management and other potential sources at Rhizotron building/greenhouses to improve water quality University of Georgia | November 2011
Recommendations cont. • Consider retrofits or new stormwater BMPs on campus • Water quality treatment for TSS, nutrients and metals • Reduce downstream erosive velocities • Sustainability • Go-green initiative • Construction activities • Operations and maintenance of facilities • Address maintenance issues at MS4-3 and MS4-4c • Public education on campus • Support ACC’s public education efforts • Stormwater 101 University of Georgia | November 2011