Download
1 / 28
280 likes | 449 Vues
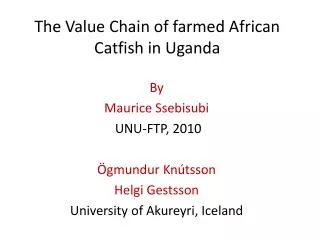
The Value Chain of farmed African Catfish in Uganda. By Maurice Ssebisubi UNU-FTP, 2010 Ögmundur Knútsson Helgi Gestsson University of Akureyri, Iceland. 1.0 Background. Figure 1: Map showing location of Uganda and major water bodies. 1.1 Important aspects of Aquaculture in Uganda.

E N D
The Value Chain of farmed African Catfish in Uganda By Maurice Ssebisubi UNU-FTP, 2010 Ögmundur Knútsson Helgi Gestsson University of Akureyri, Iceland
1.0 Background Figure 1: Map showing location of Uganda and major water bodies
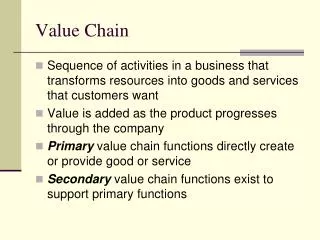
1.1 Important aspects of Aquaculture in Uganda • Species- Catfish and Nile tilapia approx: 70:30 (USAID 2009; FAO 2010) • Systems: Earthen ponds and Cages (USAID 2008) • Global contribution: 0.05% (FAO 2009) • Available figures on employment: 32,000 (FAO 2005) • Farmed Catfish products • Catfish fingerlings and Bait • Table size fish
1.2 Research Question “What value creation changes should African catfish farmers in Uganda adopt to improve sales, cost performance and margins?”
1.3 Rationale • Uganda’s Obligation to UN-FAO constitution Article 1(d) “pertinent need to improve processing, marketing and distribution of food and agricultural products” (FAO 1945). Strategic Framework 2000-2015 and 2010-2019 (FAO 2000; FAO 2010) • The Uganda National Aquaculture Development Strategy (2008) third principle “to make aquaculture a profitable investment” through “enhanced marketing efforts” (UNADS 2009)
1.4 Goal To develop structural changes in the African Catfish Value Chain that can improve profitability of farm African catfish products. How? • Determine the main actors, distribution channels and relationships in marketing African catfish products • Analyse the different value chains for African catfish products, their relative value distribution and their implications to farmers • Determine the product needs of value chain customers to suggest key success factors that can improve profitability of African catfish farming in Uganda
2.0 Methodology • Data was collected (July 2010) from both primary sources and secondary sources Primary data -using questionnaires, interviews and FGDs from Kamuli, Iganga, Jinja, Wakiso, Mukono, Kampala Districts • Respondents: fish farmers, fish processors, fish traders, restaurants/hotels and supermarkets and consumers • Interviews from Icelandic fish farms were conducted for suggestions on key success factors Secondary data -using desktop and online reviews on literature available on the various aspects of the aquaculture sector
2.0 Methodology Sampling • Farmers • Purposive sampling (Farmers who have harvested fish and are accessible within Uganda and Iceland) • N = 91 for Uganda and 2 for Iceland • Consumers • Random sample • N=150 • Restaurants (13), Traders (45), Processors (6) • Processors from Iceland (N= 3) • Norlandia, Egilsilld and FiskeldisstöðinHlíð
2.0 Methodology • Determinants of profitability: Porter’s five forces model (Porter 1998) • Value chain Analysis: Kaplinsky and Morris (2000) and Gereffi (2005) • Industrial Key Success factors: Grant (2005)
3.0 Results Production of catfish in Uganda Aquaculture Wild Figure 2: Production of African catfish in Uganda since 1980 (FAO-Fishstat 2009)
3.1 Recommended Demand Demand of fish in Uganda Approx 0.5 million tonnes at 15.8kg/capita (UNEP 2004) Deficit 0.1 million tonnes Demand of fish Regionally Regional demand approx 2.9million tonnes (FAO 2010) Deficit approx 2.1 million tonnes Demand for catfish bait Approx 3 million pcs/day around lake victoria (Isyagi 2007)
3.2 Determinants of African catfish farming industry profitability (Porter’s 5 Forces model)
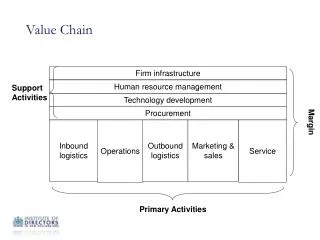
3.3 Structure of farmed African catfish value chains Primary Actors Inputs (1 feed supplier, 11 hatcheries, 1 net factory) Farmers (Earthen ponds, Mono and Polyculture) Farmers Associations (KFFA, WAFICOS, IZFFA) Middlemen (Agents and wholesalers) Processors (Artisanal and Industrial) Retailers (fresh and processed catfish) Support Actors Government, ARDC, Donor Projects and NGOs
3.2.1 Flow of products Flow for Regional Exports Total volume of farmed catfish exiting production Total volume entering and exiting intermediary actors From intermediary actors to the downstream part of the chain for consumption and utilisation
3.2.2 The two functional Value chains • 1. Domestic • Grow-out farmer ---> middleman ---> Processors and • Retailers ---> Consumer • 2. Regional • Grow-out farmer ---> Farmers Group (Coops) ---> Processor ---> Regional exports
3.3 Information and learning within the chains • Problem: Many small sized farms with low volumes produced (Muir & Aurell 2009) • 1. Domestic value chain • Generally lack of information flow. Blocked by middlemen to keep in business (Knútsson 2001). Zero-sum relationship (Gummesson 2002) • 2. Regional value chain • Better information flow horizontally between farmers and coop and vertically from the Industrial processor (Quality, price, scheduling). Emerging plus sum relationship (Kim & Mauborgne 2005)
3.4 Power and Trustwithin the chains • Small uncoordinated producers lack power (Herr 2007). General lack of power for catfish farmers • 1. Domestic value chain • Collectors set the price and have high bargaining power • “We do not have enough fish in our individual ponds to take to better paying markets so they come with a pickup or motorcycle and collect from each of us” • Mr. Kalizimbawa with a group of five fish farmers in Nabitambala, Jinja District • 2. Regional value chain • Few bulk purchasers creating a market monopoly and high bargaining power (Knútsson 2001). Better control of price
3.5 Governancewithin the chains • Governance is needed for small producers to be competitive (Gereffi et al. 2005) • 1. Domestic value chain • Generally lack of governance. Blocked by size of farm and proximity. A ‘supply’ driven (push) system of production (Wilkinson 2006) • Catfish is produced and farmers wait for a willing buyer • 2. Regional value chain • Good cooperation with emerging ‘demand’ driven production. Governance of procurement, production, and marketing handled by Coop vertically from the Industrial processor as demanded by regional customer (Wilkinson 2006)
3.6 Value added distribution Product flow Figure 3Price ranges and distribution along the African catfish value chain in Uganda (2011)
3.6 Value added distribution • Overall the value added between the actors is positive • However, they have a high degree of variation Loc et al. (2010), • Nigeria, related similar variations in value of table size catfish farm gate prices (2.39 to 3.33 USD/kg) to the size at harvest (Veliu et al. 2009) • The average total value added for live catfish flowing through the actors is approximately 2 USD/kg • Added value between actors in the domestic and export chain are relatively similar at 2.1 and 1.8 USD/kg • Accumulators contributed the lowest value added about 15 % of the average retail value. A similar situation in Nigeria was attributed to lack of cold storage (Veliu et al. 2009)
3.7 Key factors for competitive success (KFCS) • Combination of how and what the catfish farmer and processor in Uganda should do in order to satisfy the customer (Grant 2005) • Customer needs: • Domestic chain: relatively low priced product, consistent supply, a quality product, closer to homesteads, and big in size • Regional chain: consistent supply, a quality product • What our Competitors are doing • Offer products consistently in time and space • No erratic increases in prices • Demand for substitutes is seasonal (Dhatemwa 2009) • Sell products with little differentiation • Traders of fresh Nile perch frames and heads take the product near the consumer in Ice pick-up trucks (Erik 2010)
3.7.1 KFCS in Domestic value chain • Low production costs • Increasing the farmers’ bargaining power over supply of inputs (Olagunju et al. 2007). Hólalax (Mr. Friðrik), keeps a closely works with the feed producer Laxá to improve your bargaining power • Avoiding middlemen • Fiskeldisstöðin Hlíð has all the value creation under one roof. Deals directly with the customers shunting the middleman. Stable price for past ten years • Where middlemen can not be avoided, collaboration in the whole chain is important (Knútsson 2001) • “We hold meetings with the middlemen and distributors for discussions about prices, no contracts only trust. In this relationship, feedback and response is important.” Norlandia managing director Mr. Ásgeir • New product development for consumer acceptability and competitiveness (Asche et al. 2001) • “……we discuss strategies of testing new products on the Nigerian market like how we started the bales of blue whiting which is now fetching more price……”. Mr. Ásgeir
3.7.1 KFCS in Domestic value chain • Consistent quantity and quality command high prices for smallholders (Jagger & Pender 2001) • For example Mr. Gunnar smoked salmon fillets yet at times would not get raw materials. Solved by having supply from his fish farm so that the customer could still access the product anytime for the last twenty years • Produce what the customers can consume, then plan and build demand gradually (Subhash 2000) • It is not advisable to have big investments into fish farming prior to determining the market demand for your products according to Mr. Friðrik (Holalax) • Fish farming is a technically risky business (Leonard & Blow 2007) • Farmers should put all their effort where their investment is and not expect free assistance Mr. Friðrik (Holalax)
3.7.2 KFCS in Regional value chain “...if you have a good quality raw material…am sure you can turn it into a good product but how to do it..that is the question…”Mr. Ásgeir Harvest the fish with minimum stress (Mr. Friðrik) and deliver it to the next actor in the value chain in as much the same condition as it was harvested (Petra C 2010) Processing environment has to be hygienic (Keane 2008). “…Here there three rules: number one two three are hygiene, hygiene and hygiene….this very important, everything has to be extremely clean”Mr. Kristján; managing director Egilssíld Icelandic firms have realised the need for product presentation “You buy food with the eyes and product presentation is so important”Mr. Gunnar. “The fish not only needs to be fresh but needs to look good….” Mr. Kristján
4.0 Conclusion How profitable is the industry and who are the main actors? Low profitability industry Middlemen, Farmers groups, processors, retailers What distribution channels and Relationships? Domestic chain: Zero sum Regional chain: Plus sum How is the relative value distribution? Domestic chain: governed by middlemen Regional chain: governed by Coops and Industrial processor Added value distribution: positive with high price variation What are key success factors that can improve profitability of African catfish farming in Uganda? Domestic chain: cooperation Regional chain: competitive quality products
5.0 Recommendations Cooperation in the domestic chain to improve power Existing Cooperatives should be supported to reinforce the regional export value chain for global competitiveness Further research needed to elaborate the structure and function of farmed fish value chains Tracking of fish volumes through the chain. Also Input costs at each link to determine the exact added margin instead of value added Trace the regional export value chain into the neighbouring countries Determine the specific support different chain actors need to comply with emerging environmental and social, regulations and standards What new public-private partnerships to adopt to regulate production using private sector led value chain governance
6.0 Acknowledgements UNU-FTP University of Akureyri
THANK YOU SALMON FILLETS Egilsilld CATFISH FILLETS Supermarket