Download

1 / 74
1.04k likes | 1.65k Vues
Heuristics and Biases. Behavioral and Experimental Economics. Making Decisions under Uncertainty. Many decisions are based on beliefs concerning the likelihood of uncertain events… What determines such beliefs?

E N D
Heuristics and Biases Behavioral and Experimental Economics
Making Decisions under Uncertainty Many decisions are based on beliefs concerning the likelihood of uncertain events… What determines such beliefs? How do people assess the probability of an uncertain event or the value of an uncertain quantity?
We Use Heuristics We reduce the complex tasks of assessing probabilities and predicting values to simpler judgmental operations. Resembles the subjective assessment of physical quantities such as distance or size. Example of how we judge the distance of an object using clarity.
Introduction What is a heuristic? Why do humans use them? Do heuristics help or hurt human decision making?
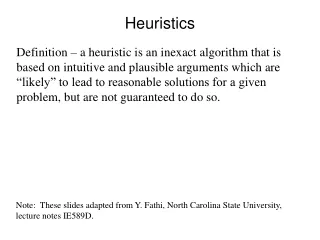
Definition from Wikipedia Heuristic ( /hjʉˈrɪstɨk/; or heuristics; Greek: "Εὑρίσκω", "find" or "discover") refers to experience-based techniques for problem solving, learning, and discovery. Heuristic methods are used to speed up the process of finding a satisfactory solution, where an exhaustive search is impractical. Examples of this method include using a "rule of thumb", an educated guess, an intuitive judgment, or common sense. In more precise terms, heuristics are strategies using readily accessible, though loosely applicable, information to control problem solving in human beings and machines.[1]
Kahneman and Tversky http://nobelprize.org/nobel_prizes/economics/laureates/2002/kahneman-autobio.html http://www.dangoldstein.com/dsn/archives/2005/07/amos_tversky_1.html "Judgment under Uncertainty: Heuristics and Biases," Science,1974. James Monitier “Behaving Badly,” 2/2006. http://papers.ssrn.com/sol3/papers.cfm?abstract_id=890563
Source of Bias • Three Heuristics that are used to assess probabilities and predict values: • Representativeness • Availability • Adjustment and Anchoring
Misconception of Regression Anchoring Framing Overconfidence Confirmatory bias Frederick’s CRT Keynes’ Beauty Contest Problem
Example Linda is 31 years old. She is single, outspoken and very bright. She majored in philosophy. As a student, she was deeply concerned with issues of discrimination and equality. Which is more likely? 1) Linda works in a bank 2) Linda works in a bank and is active in the feminist movement
Representativeness It is more likely that Linda works in a bank. To argue that (2) is more likely is to commit a conjunction fallacy. Tversky & Kahneman (1983) Bankers 85% of professional fund managers chose (1) Feminist Bankers Feminists
Representativeness Source of the error? The Representative Heuristic (rule of thumb) People base judgments on how things appear rather than how statistically likely they are. People are driven by the narrative of the description rather than by the logic of the analysis.
Representativeness "The best explanation to date of the misperception of random sequences is offered by psychologists Daniel Kahneman and Amos Tversky, who attribute it to people’s tendency to be overly influenced by judgments of “representativeness.” Representativeness can be thought of as the reflexive tendency to assess the similarity of outcomes, instances, and categories on relatively salient and even superficial features, and then to use these assessments of similarity as a basis of judgment. We expect instances to look like the categories of which they are members; thus, we expect someone who is a librarian to resemble the prototypical librarian. We expect effects to look like their causes; thus we are more likely to attribute a case of heartburn to spicy rather than bland food, and we are more inclined to see jagged handwriting as a sign of a tense rather than a relaxed personality.“ Gilovich (1991), page 18
To Clarify We EXPECT EFFECTS TO LOOK LIKE CAUSES….. What does this mean?
Subsets of Representativeness 1. Insensitivity to prior probabilities of outcome: Example engineers versus lawyers and Bayes’ rule
More types of representativeness 2. Insensitivity to sample size Example: What is the average height of the following group of men? N = 1000 N = 100 N = 10 How do you make this assessment?
Sample Size People failed to appreciate the role of sample size. As n increases, variability decreases John Nunley and I both got decent merit scores last year, but I taught 3 classes and he taught 6… What does that mean?
Example: • A certain town is served by two hosptials. In the larger hospital about 45 babies are born each day, and in the smaller hospital about 15 babies are born each day. As you know, about 50 percent of all babies are boys. However, the exact percentage varies from day to day. • For a period of one year, each hospital recorded the days on which more than 60 percent of the babies born were boys. Which hospital do you think recorded such days?
Results from undergrad students The larger hospital (21) The smaller hospital (210 About the same (that is, within 5 percent of each other) (53) Discuss
Another example Imagine an urn filled with balls, of which 2/3 are of one color and 1/3 of another. One individual has drawn 5 balls from the urn, and found that 4 were red and 1 was white. Another individual has drawn 20 balls anf found that 12 were red and 18 where white. Which of the two individuals should feel more confident that the urn contains 2/3 red balls and 1/3 white balls, rather than the opposite?
Explanation Intuitive judgments are dominated by the sample proportion and are essentially unaffected by the size of the sample, which place a crucial role in the determination of the actual posterior odds.
Types of representativeness 3. Misconceptions of chance (the gambler’s fallacy) People expect that a sequence of events generated by a random process will represent the essential characteristics of that process even when the sequence is short. Example: People think that HTHTTH is more likely than HHHTTT or HHHTH
Representativeness: Gambler’s Fallacy Suppose an unbiased coin is flipped 3 times, and each time it lands on head. If you had to bet $1,000 on the next toss, what side would you chose? Heads, Tails or no preference? 300 fund managers: no preference = 81% Of the 29 2010 BEE students: No preference = 17 of 23 (74%) Tails = 4 (17%) Heads = 2 (8%) What is going on here?
The Gambler’s Fallacy Source of the fallacy? The coin has no memory and each side is equally likely You are betting on a SINGLE flip, not an ENTIRE sequence
The Gambler’s Fallacy The Gambler’s Fallacy and the Hot Hand: Empirical Data from Casinos Rachel Croson and James Sundali Journal of Risk and Uncertainty (2005) Abstract Research on decision making under uncertainty demonstrates that intuitive ideas of randomness depart systematically from the laws of chance. Two such departures involving random sequences of events have been documented in the laboratory, the gambler’s fallacy and the hot hand. This study presents results from the field, using videotapes of patrons gambling in a casino, to examine the existence and extent of these biases in naturalistic settings. We find small but significant biases in our population, consistent with those observed in the lab.
Representativeness Posterior OddsUrn is 2/3 Red Joe’s Sample 8-to-1 Red Betty’s Sample 16-to-1 Red Who should be more confident that the urn contains 2/3 red balls and 1/3 white? Conclusion: People underestimate evidence
Explanation Chance is commonly viewed as a self-correcting process in which a deviation in one direction induces a deviation in the opposite direction to restore the equilibrium. In fact, deviations are not “corrected” as a chance process unfolds, they are merely diluted.
Types of representativeness 4. Insensitivity to predictability: if predictability is nil, the same prediction should be made in all cases. (Example: which company will be profitable? What info do you have to make this assessment?)
Types of representativness 5. Illusion of validity: The unwarranted confidence which is produced by a good fit between the predicted outcome and the input information 6. Misconception of regression: people don’t get regression toward the mean. People don’t expect regression in many contexts where it is bound to occur and When they see it, they invent spurious causal explanations for it.
Pilot Training Example(Tversky and Kahneman (1974)) Pilot instructors note that… Praise for an exceptionally smooth landing is typically followed by a poor landing on next try. Criticism for a rough landing is typically followed by an improvement on next try. Conclusion: Verbal rewards are detrimental to learning, while verbal punishments are beneficial.
Misconception of Regression Probability What’s more likely? Improvement or an even worse performance? Mean Performance Bad
Availability People assess the frequency of a class or the probability of an event by the ease with which instances or occurancescan be brought to mind
Subsets of Availability • Biases due to retrievability of the data • Familiarity: example lists of famous people • Salience: seeing a house burning • Recent-ness • Biases due to the effectiveness of a search set: searching for words by first letter • Biases of Imaginability • Illusory Correlation: example mental patients with clinical diagnosis and drawings.
Anchoring & Adjustment 1. What are the last four digits of your telephone number? 2. Is the number of physicians in Wisconsinhigher or lower than that number? 3. What is your best guess as to the number of physicians in Wisconsin?
Anchoring Mean guesses of number of physicians Last 4 digits of telephone # Sources: “Behaving Badly” (2006) and B.E. Class Survey
What is going on? Anchoring – the tendency to grab hold of irrelevant and subliminal inputs in the face of uncertainty. If people are “rational,” there should be no difference between those who happen to have high telephone numbers and those who have low ones
Subsets of Anchoring • Adjustments are typically insufficient: Example: estimating 8x7x6x5x4x3x2x1 veruss 1x2x3x4x5x6x7x8 • median for ascending: 512 • Median for descending: 2,250 • Actual answer: 40,320 • Biases in the evaluation of conjunctive and disjunctive events: example: • Simple events: draw a red marble from a bag with 50 percent red and 50 percent white • Conjunctive: draw a red marble 7 times in succession with replacement from a bag containing 90% red • Disjunctive: draw a red marble at least oncein 7 successive tries with replacement from a bag containing 10 percent red.
Other Heuristics Framing Hindsight bias Black Swans The Affect Heuristic Scope Neglect Overconfidence Bystander Apathy
Framing The U.S. is preparing for the outbreak of an unusual disease, which is expected to kill 600 people. Two alternative programs to combat the disease have been proposed. The scientific estimates of the consequences of the programs are as follows: If program A is adopted 200 people will be saved. If program B is adopted there is a 1/3 probability that 600 people will be saved, and a 2/3 probability that no one will be saved. Which program do you choose?
Framing The U.S. is preparing for the outbreak of an unusual disease, which is expected to kill 600 people. Two alternative programs to combat the disease have been proposed. The scientific estimates of the consequences of the programs are as follows: If program C is adopted 400 people will die. If program D is adopted there is a 1/3 probability that nobody will die, and a 2/3 probability that 600 people will die. Which program do you choose?
Framing Live prob. Die prob. Program A 200 1 400 1 Program B 600 1/3 600 2/3 Program C 200 1 400 1 Program D 600 1/3 600 2/3 Consistent Preferences imply: If you pick A over B, you should pick C over D
Framing:ECO474 BE 2011 Question #9 Question #12
Over-Optimism (Over Confidence) Bias Do you expect to perform above or below average in this course? Above Average Below 2011 1210
Results for over 300 fund managers Over-Optimism Bias Source: Global Equity Strategy, “Behaving Badly” (2006)
Sources of Over-Optimism Bias? Illusion of Control (people think they can influence the outcome) Illusion of Knowledge (people think they know more than everyone else) Evolutionary Explanations of Overconfidence?
“The Evolution of Overconfidence”Jonson and Fowler (2009) Overconfidence – believing that you are better than you are in reality Disadvantages? - increases arrogance- dangerous risk taking Advantages? - increases ambition- better morale- superior ability to bluff opponents Overconfident individuals compete against ordinary individuals. Overconfident populations are evolutionarily stable.
Confirmatory Bias Imagine four playing cards laid out in front of you. 4 7 E K Each one has a letter on one side and a number on the other. If a card has an E, it should have a 4. Which cards do you need to turn over to see if I’m telling the truth?