Download
1 / 22
240 likes | 481 Vues
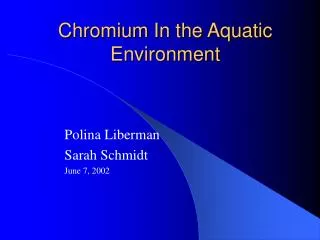
Distribution of organotin compounds in aquatic environment. Hiroya Harino. Osaka City Institute of Public Health and Environmental Sciences. Ph. Bu. Ph. Sn. X. Bu. X. Sn. Bu. Ph. X. Ph. X. Bu. (TPT). (TBT). Ph. Sn. X. Bu. Sn. X. Ph. Sn. X. Bu. Sn. X. X. X. X. X.

E N D
Distribution of organotin compounds in aquatic environment Hiroya Harino Osaka City Institute of Public Health and Environmental Sciences
Ph Bu Ph Sn X Bu X Sn Bu Ph X Ph X Bu (TPT) (TBT) Ph Sn X Bu Sn X Ph Sn X Bu Sn X X X X X (MBT) (DBT) (MPT) (DPT) Phenyltin compounds Butyltin compounds (Pts) (Bts) Organotin compounds
A9 Yodo R. Osaka A1 A2 Osaka City A3 A4 A7 A6 Kizu R. A5 A8 Osaka Bay 2 1 3km 0 Sampling sites (The Port of Osaka, Japan)
Aquatic organisms(1-10g) Sediment (10g) Water (1L) HCl HCl HCl Acetone Acetone Acetone Benzene containing 0.1% tropolone Extract Homogenate Centrifugation at 3000 r.p.m Centrifugation at 3000 r.p.m Extract Supernatant Supernatant Concentration Distilled water Distilled water Propyl magnesium bromide Benzene containing 0.1% tropolone Benzene containing 0.1% tropolone Propylation Distilled water Extract Extract Hexane containing 10%benzene Tetrabutylhydrogen sulfate Extract Sodium sulfite Desulfur Frorisil column chromatography GC - FPD Analytical method of organotin compounds
Objects Temporal trend of organotin compounds in water, sediment and biological samples from the Port of Osaka Current status of organotin compounds in water, sediment and biological samples from the Port of Osaka Partition of organotin between water and the other compartments
Table Events for organotin compounds in Japan Year Events Jan. 1990 :TBTO was designated as a Class 1 Specified Chemical Substance. :Seven TPT species were designated as Class 2 Specified Chemical Substances. Sep. 1990 :Thirteen TBT species were designated as a Class 2 Specified Chemical Substances. :Environment Agency set guideline. Ots concentration in the area within 100m from source on ones was under 0.1g/l and that in the other area was 0.01g/l.
(g/l) (%) 0.3 100 MBT TBT DBT A2 A2 80 max 0.2 1.04 60 Concentration of TBT Composition of Bts 40 0.1 20 0 0 1992 1994 1996 1989 1990 1991 1992 1993 1994 1995 1996 1990 1989 1991 1993 1995 100 0.3 A4 A4 80 0.2 60 Concentration of TBT 40 Composition of Bts 0.1 20 0 0 1989 1990 1991 1992 1993 1994 1995 1996 1990 1992 1994 1996 1989 1991 1993 1995 0.3 100 A8 A8 80 0.2 60 Composition of Bts 40 Concentration of TBT 0.1 20 0 0 1990 1991 1992 1993 1994 1995 1996 1990 1992 1994 1996 1991 1993 1995 Year Year Temporal trend of butyltin compounds in water
(mg/kg dry wt) (%) 100 2.5 A2 A2 MBT TBT DBT 80 2 60 Concentration of TBT 1.5 Composition of Bts 40 1 20 0.5 0 0 1990 1991 1992 1993 1994 1995 1996 1990 1992 1994 1996 1991 1993 1995 100 2.5 A4 A4 80 2 Composition of Bts 60 1.5 Concentration of TBT 40 1 20 0.5 0 0 1990 1991 1992 1993 1994 1995 1996 1990 1992 1994 1996 1991 1993 1995 Year Year Temporal trend of butyltin compounds in sediment
(mg/kg dry wt) (%) 100 10 MBT DBT A4 A4 80 TBT 8 60 6 Concentration of TBT Composition of Bts 40 4 20 2 0 0 1989 1990 1991 1992 1993 1994 1995 1996 1990 1992 1994 1996 1989 1991 1993 1995 100 10 A5 A5 80 8 Composition of Bts 60 6 Concentration of TBT 40 4 20 2 0 0 1989 1990 1991 1992 1993 1994 1995 1996 1990 1992 1994 1996 1989 1991 1993 1995 Year Year Temporal trend of butyltin compounds in plankton
(%) ( mg/kg wet wt) 100 1.5 Max 2.4 A2 MBT DBT TBT A2 80 1 60 Concentration of TBT Composition of Bts 40 0.5 20 0 0 1989 1990 1991 1992 1993 1994 1995 1996 1990 1992 1994 1996 1989 1991 1993 1995 100 1.5 A5 A5 80 1 60 Composition of Bts Concentration of TBT 40 0.5 20 0 0 1989 1990 1991 1992 1993 1994 1995 1996 1990 1992 1994 1996 1989 1991 1993 1995 100 1.5 A8 A8 80 1 60 Composition of Bts Concentration of TBT 40 0.5 20 0 0 1990 1992 1994 1996 1990 1991 1992 1993 1994 1995 1996 1991 1993 1995 Year Year Temporal trend of butyltin compounds in mussel
(mg/kg wet wt) 2.0 A2 1.5 1.0 Concentration of TPT 0.5 0 1990 1992 1994 1996 1989 1991 1993 1995 Year 2.0 A5 1.5 1.0 Concentration of TPT 0.5 0 1990 1992 1994 1996 1989 1991 1993 1995 Year Temporal trend of triphenyltin in mussel
(mg kg-1 wet) (mg kg-1 wet) 0.1 0.15 Phenyltins Butyltins 0.08 0.1 Concentration Concentration 0.06 0.04 0.05 0.02 0 0 1991 1993 1995 1997 1999 1991 1993 1995 1997 1999 1992 1994 1996 1998 1992 1994 1996 1998 Butyltin and phenyltin compounds in fish from the Port of Osaka Tri- Di- Mono-
( μ g/l) (mg/kg dry) 0.05 5 Water Plankton 0.04 4 0.03 3 Concentration of TBT Concentration of TBT 0.02 2 0.01 1 A3 A4 A5 A6 A7 A8 A1 A2 A3 A4 A5 A6 A7 A8 A1 (mg/kg dry) (mg/kg wet) 0.5 2.5 Mussel Sediment 2 0.4 1.5 0.3 Concentration of TBT Concentration of TBT 1 0.2 0.5 0.1 0 A3 A4 A5 A6 A7 A8 A1 A2 A5 A8 A2 Current status of tributyltin in the Port of Osaka
Water Sediment Plankton A1 A1 A1 A2 A2 A3 A3 A3 A4 A4 A5 A4 A6 A5 A5 A6 A7 A6 A8 A7 A7 A8 A8 0% 50% 100% 0% 50% 100% 0% 50% 100% Mussel A2 A5 A8 0% 50% 100% Composition of butyltin compounds in water, sediment, plankton and mussel MBT DBT TBT
A9 Yodo R. Osaka A1 A2 Osaka City A3 A4 A7 A6 Kizu R. A5 A8 Osaka Bay 2 1 3km 0 Sampling sites (The Port of Osaka, Japan)
Japanese Butter White Yellow Band Triped Silver Gray Japanese croaker whiting sea perch tail puffer mullet fish fish barbel Sea areas Rivers (mg/kg wet wt.) 0.2 0.15 TBT Concentration 0.1 TPT 0.05 0 File fish Bluegill Habitat Tributyltin and triphenyltins in various fish
Phenyltin compounds Butyltin compounds DPT MPT TPT MBT DBT TBT Silver whiting White croaker Japanese sea perch Triped pufer Triped pufer Bandfish White croaker Yellowtail Silver whiting Yellowtail Butter fish File fish Japanese sea perch Bandfish Butter fish File fish Bluegill Bluegill Japanese barbel Japanese barbel Gray mullet Gray mullet 0 50 100 (%) 0 50 100 (%) Composition Composition Composition of butyltin and phenyltins in various fish
(mg/kg wet wt.) 0.5 Japanese sea perch TBT 0.4 Concentration 0.3 0.2 TPT 0.1 0 Liver Heart Stomach Gonad Spleen Kidney Brain Muscle Gill Scale (mg/kg wet wt.) 0.3 White croaker Concentration 0.2 0.1 0 Liver Brain Muscle Spleen Kidney Stomach Heart Gonad Vertebra Skin Gill Scale (mg/kg wet wt.) 0.3 Yellowtail Concentration 0.2 0.1 0 Liver Heart Kidney Stomach Brain Spleen Muscle Scale Skin Gill Vertebra Body distribution of tributyltin and triphenyltin in fish
(%) (%) 100 100 MPT MBT DPT 80 80 DBT TPT TBT 60 60 Composition of PTs 40 40 Composition of BTs 20 20 0 0 Japanese sea perch Yellowtail Japanese sea perch Yellowtail White croaker White croaker Composition of butyltin and phenyltin compounds in liver
Partition coefficients of Bts 0 6 2 4 10 10 10 10 MBT DBT Sediment TBT MBT DBT Plankton TBT MBT Mussel DBT TBT Partition of butyltin compounds
Table Bioconcentration factor of fish samples Sampling Number of BCF Specimen locality sample (means) Japanese sea perch Station A5 2 3.7 White croaker Station A5 2 3.7 Yellowtail Station A5 2 3.8 Station A5 2 3.8 Bandfish Silver whiting Station A5 3 3.9 Butter fish Station A5 3 3.7 Station A5 1 3.3 File fish Station A5 1 3.8 Triped puffer Gray mullet Station A8 2 2.7 Japanese barbel Station A8 3 3.0 Bluegill Station A8 3 3.1
Conclusion Temporal Trend of TBT Water:decreasing, Sediment:uniformity, Plankton:decreasing, Mussel:decreasing, Fish:decreasing Current status of OTs Water :Concentration of TBT was above 1ng l-1. Sediment :Higher level of TBT was detected. Fish :TBT and TPT were detected. Partition of TBT to sediment and biological samples Sediment : 4.6, Plankton : 5.2, Mussel : 4.1, Fish : 3.7