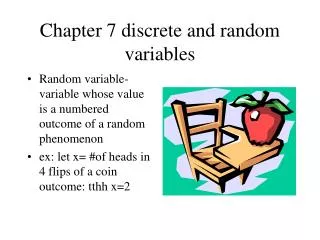
Chapter 7 Using Indicator Variables
Chapter 7 Using Indicator Variables. Walter R. Paczkowski Rutgers University. Chapter Contents. 7.1 Indicator Variables 7.2 Applying Indicator Variables 7 .3 Log-linear Models 7 .4 The Linear Probability Model 7 .5 Treatment Effects.


Chapter 7 Using Indicator Variables
E N D
Presentation Transcript
Chapter 7 Using Indicator Variables Walter R. Paczkowski Rutgers University
Chapter Contents • 7.1 Indicator Variables • 7.2 Applying Indicator Variables • 7.3 Log-linear Models • 7.4 The Linear Probability Model • 7.5 Treatment Effects
Economists develop and evaluate theories about economic behavior • Hypothesis testing procedures are used to test these theories • Theories economists develop sometimes provide nonsample information that can be used along with the sample information to estimate the parameters of a regression model • A procedure that combines these two types of information is called restricted least squares
6.1 Joint Hypothesis Testing
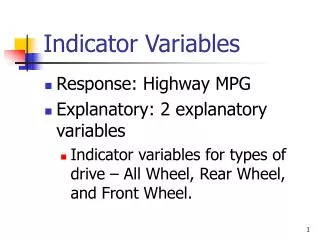
7.1 Indicator Variables • Indicator variables allow us to construct models in which some or all regression model parameters, including the intercept, change for some observations in the sample
7.1 Indicator Variables • Consider a hedonic model to predict the value of a house as a function of its characteristics: • size • Location • number of bedrooms • age
7.1 Indicator Variables • Consider the square footage at first: • β2 is the value of an additional square foot of living area and β1 is the value of the land alone Eq. 7.1
7.1 Indicator Variables • How do we account for location, which is a qualitative variable? • Indicator variables are used to account for qualitative factors in econometric models • They are often called dummy, binary or dichotomous variables, because they take just two values, usually one or zero, to indicate the presence or absence of a characteristic or to indicate whether a condition is true or false • They are also called dummy variables, to indicate that we are creating a numeric variable for a qualitative, non-numeric characteristic • We use the terms indicator variable and dummy variable interchangeably
7.1 Indicator Variables • Generally, we define an indicator variable D as: • So, to account for location, a qualitative variable, we would have: Eq. 7.2
7.1 Indicator Variables 7.1.1 Intercept Indicator Variables • Adding our indicator variable to our model: • If our model is correctly specified, then: Eq. 7.3 Eq. 7.4
7.1 Indicator Variables 7.1.1 Intercept Indicator Variables • Adding an indicator variable causes a parallel shift in the relationship by the amount δ • An indicator variable like D that is incorporated into a regression model to capture a shift in the intercept as the result of some qualitative factor is called an intercept indicator variable, or an intercept dummy variable
7.1 Indicator Variables 7.1.1 Intercept Indicator Variables • The least squares estimator’s properties are not affected by the fact that one of the explanatory variables consists only of zeros and ones • D is treated as any other explanatory variable. • We can construct an interval estimate for D, or we can test the significance of its least squares estimate
7.1 Indicator Variables FIGURE 7.1 An intercept indicator variable 7.1.1 Intercept Indicator Variables
7.1 Indicator Variables 7.1.1a Choosing the Reference Group • The value D = 0 defines the reference group, or base group • We could pick any base • For example:
7.1 Indicator Variables 7.1.1a Choosing the Reference Group • Then our model would be:
7.1 Indicator Variables 7.1.1a Choosing the Reference Group • Suppose we included both D and LD: • The variables D and LD are such that D + LD = 1 • Since the intercept variable x1 = 1, we have created a model with exact collinearity • We have fallen into the dummy variable trap. • By including only one of the indicator variables the omitted variable defines the reference group and we avoid the problem
7.1 Indicator Variables 7.1.2 Slope Indicator Variables • Suppose we specify our model as: • The new variable (SQFT x D) is the product of house size and the indicator variable • It is called an interaction variable, as it captures the interaction effect of location and size on house price • Alternatively, it is called a slope-indicator variable or a slope dummy variable, because it allows for a change in the slope of the relationship Eq. 7.5
7.1 Indicator Variables 7.1.2 Slope Indicator Variables • Now we can write:
FIGURE 7.2 (a) A slope-indicator variable (b) Slope- and intercept-indicator variables 7.1 Indicator Variables 7.1.2 Slope Indicator Variables
7.1 Indicator Variables 7.1.2 Slope Indicator Variables • The slope can be expressed as:
7.1 Indicator Variables 7.1.2 Slope Indicator Variables • Assume that house location affects both the intercept and the slope, then both effects can be incorporated into a single model: • The variable (SQFTD) is the product of house size and the indicator variable, and is called an interaction variable • Alternatively, it is called a slope-indicator variable or a slope dummy variable Eq. 7.6
7.1 Indicator Variables 7.1.2 Slope Indicator Variables • Now we can see that:
7.1 Indicator Variables 7.1.3 An Example: The University Effect on House Prices • Suppose an economist specifies a regression equation for house prices as: Eq. 7.7
7.1 Indicator Variables Table 7.1 Representative Real Estate Data Values 7.1.3 An Example: The University Effect on House Prices
7.1 Indicator Variables Table 7.2 House Price Equation Estimates 7.1.3 An Example: The University Effect on House Prices
7.1 Indicator Variables 7.1.3 An Example: The University Effect on House Prices • The estimated regression equation is for a house near the university is: • For a house in another area:
7.1 Indicator Variables 7.1.3 An Example: The University Effect on House Prices • We therefore estimate that: • The location premium for lots near the university is $27,453 • The change in expected price per additional square foot is $89.12 for houses near the university and $76.12 for houses in other areas • Houses depreciate $190.10 per year • A pool increases the value of a home by $4,377.20 • A fireplace increases the value of a home by $1,649.20
7.2 Applying Indicator Variables
7.2 Applying Indicator Variables • We can apply indicator variables to a number of problems
7.2 Applying Indicator Variables 7.2.1 Interactions Between Qualitative Factors • Consider the wage equation: • The expected value is: Eq. 7.8
7.2 Applying Indicator Variables Table 7.3 Wage Equation with Race and Gender 7.2.1 Interactions Between Qualitative Factors
7.2 Applying Indicator Variables 7.2.1 Interactions Between Qualitative Factors • Recall that the test statistic for a joint hypothesis is:
7.2 Applying Indicator Variables 7.2.1 Interactions Between Qualitative Factors • To test the J = 3 joint null hypotheses H0: δ1 = 0, δ2 = 0, γ = 0, we use SSEU = 130194.7 from Table 7.3 • The SSER comes from fitting the model: for which SSER = 135771.1
7.2 Applying Indicator Variables 7.2.1 Interactions Between Qualitative Factors • Therefore: • The 1% critical value (i.e., the 99th percentile value) is F(0.99,3,995) = 3.80. • Thus, we conclude that race and/or gender affect the wage equation.
7.2 Applying Indicator Variables 7.2.2 Qualitative Factors with Several Categories • Consider including regions in the wage equation: • Since the regional categories are exhaustive, the sum of the regional indicator variables is NORTHEAST + SOUTH + MIDWEST + WEST = 1 • Failure to omit one indicator variable will lead to the dummy variable trap Eq. 7.9
7.2 Applying Indicator Variables 7.2.2 Qualitative Factors with Several Categories • Omitting one indicator variable defines a reference group so our equation is: • The omitted indicator variable, NORTHEAST, identifies the reference
7.2 Applying Indicator Variables Table 7.4 Wage Equation with Regional Indicator Variables 7.2.2 Qualitative Factors with Several Categories
7.2 Applying Indicator Variables 7.2.3 Testing the Equivalence of Two Regressions • Suppose we have: and for two locations: where α1 = β1 + δ and α2 = β2 + γ
7.2 Applying Indicator Variables 7.2.3 Testing the Equivalence of Two Regressions • By introducing both intercept and slope-indicator variables we have essentially assumed that the regressions in the two neighborhoods are completely different • We could obtain the estimates for Eq. 7.6 by estimating separate regressions for each of the neighborhoods • The Chow test is an F-test for the equivalence of two regressions
7.2 Applying Indicator Variables 7.2.3 Testing the Equivalence of Two Regressions • Now consider our wage equation: • “ Are there differences between the wage regressions for the south and for the rest of the country?’’ • If there are no differences, then the data from the south and other regions can be pooled into one sample, with no allowance made for differing slope or intercept
7.2 Applying Indicator Variables 7.2.3 Testing the Equivalence of Two Regressions • To test this, we specify: Eq. 7.10
7.2 Applying Indicator Variables 7.2.3 Testing the Equivalence of Two Regressions • Now examine this version of Eq. 7.10:
7.2 Applying Indicator Variables Table 7.5 Comparison of Fully Interacted to Separate Models 7.2.3 Testing the Equivalence of Two Regressions
7.2 Applying Indicator Variables 7.2.3 Testing the Equivalence of Two Regressions • From the table, we note that:
7.2 Applying Indicator Variables 7.2.3 Testing the Equivalence of Two Regressions • We can test for a southern regional difference. • We estimate Eq. 7.10 and test the joint null hypothesis • Against the alternative that at least one θi ≠ 0 • This is the Chow test
7.2 Applying Indicator Variables 7.2.3 Testing the Equivalence of Two Regressions • The F-statistic is: • The 10% critical value is Fc = 1.85, and thus we fail to reject the hypothesis that the wage equation is the same in the southern region and the remainder of the country at the 10% level of significance • The p-value of this test is p = 0.9009
7.2 Applying Indicator Variables 7.2.3 Testing the Equivalence of Two Regressions • Remark: • The usual F-test of a joint hypothesis relies on the assumptions MR1–MR6 of the linear regression model • Of particular relevance for testing the equivalence of two regressions is assumption MR3, that the variance of the error term, var(ei) = σ2, is the same for all observations • If we are considering possibly different slopes and intercepts for parts of the data, it might also be true that the error variances are different in the two parts of the data • In such a case, the usual F-test is not valid.
7.2 Applying Indicator Variables 7.2.4 Controlling for Time • Indicator variables are also used in regressions using time-series data
7.2 Applying Indicator Variables 7.2.4a Seasonal Indicators • We may want to include an effect for different seasons of the year
7.2 Applying Indicator Variables 7.2.4b Seasonal Indicators • In the same spirit as seasonal indicator variables, annual indicator variables are used to capture year effects not otherwise measured in a model