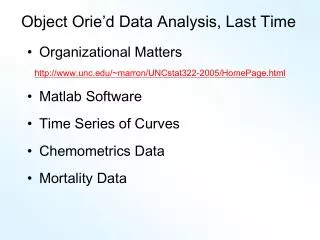
Object Orie’d Data Analysis, Last Time
Object Orie’d Data Analysis, Last Time. Reviewed Clustering 2 means Cluster Index SigClust When are clusters really there ? Q-Q Plots For assessing Goodness of Fit Very useful for Gaussian Fit Compare to 45 o line Assess variability with Q-Q Envelope Plot. Q-Q plots.

Object Orie’d Data Analysis, Last Time
E N D
Presentation Transcript
Object Orie’d Data Analysis, Last Time • Reviewed Clustering • 2 means Cluster Index • SigClust • When are clusters really there? • Q-Q Plots • For assessing Goodness of Fit • Very useful for Gaussian Fit • Compare to 45o line • Assess variability with Q-Q Envelope Plot
Q-Q plots Standard approach to checking Gaussianity • QQ – plots Background: Graphical Goodness of Fit Fisher (1983)
Q-Q plots Illustrative graphic (toy data set):
Q-Q plots Illustrative graphic (toy data set):
Q-Q plots Illustrative graphic (toy data set): Empirical Qs near Theoretical Qs when Q-Q curve is near 450 line (general use of Q-Q plots)
Q-Q plots Need to understand sampling variation • Approach: Q-Q envelope plot • Simulate from Theoretical Dist’n • Samples of same size • About 100 samples gives “good visual impression” • Overlay resulting 100 QQ-curves • To visually convey natural sampling variation
Q-Q plots non-Gaussian! departures from line?
Q-Q plots non-Gaussian! departures from line? • Envelope Plot shows: • Departures are significant • Clear these data are not Gaussian • Q-Q plot gives clear indication
Q-Q plots Gaussian? departures from line?
Q-Q plots Gaussian? departures from line? • Harder to see • But clearly there • Conclude non-Gaussian • Really needed n = 10,000 data points… (why bigger sample size was used) • Envelope plot reflects sampling variation
Q-Q plots Variations on Q-Q Plots: For theoretical distribution: Solving for gives Where is the Standard Normal Quantile
Q-Q plots Variations on Q-Q Plots: Solving for gives So Q-Q plot against Standard Normal is linear With slope and intercept
Q-Q plots Variations on Q-Q Plots: • Can replace Gaussian with other dist’ns • Can compare 2 theoretical distn’s • Can compare 2 empirical distn’s (i.e. 2 sample version of Q-Q Plot)
SigClust • Statistical Significance of Clusters • in HDLSS Data • When is a cluster “really there”? From Liu, et al. (2007)
StatisticalSignificance of Clusters Basis of SigClust Approach: • What defines: A Cluster? • A Gaussian distribution (Sarle & Kou 1993) • So define SigClust test based on: • 2-means cluster index (measure) as statistic • Gaussian null distribution • Currently compute by simulation • Possible to do this analytically???
SigClust Gaussian null distribut’n Estimated Mean (of Gaussian dist’n)? • 1st Key Idea: Can ignore this • By appealing to shift invariance of CI • When data are (rigidly) shifted • CI remains the same • So enough to simulate with mean 0 • Other uses of invariance ideas?
SigClust Gaussian null distribut’n 2nd Key Idea: Mod Out Rotations • Replace full Cov. by diagonal matrix • As done in PCA eigen-analysis • But then “not like data”??? • OK, since k-means clustering (i.e. CI) is rotation invariant (assuming e.g. Euclidean Distance)
SigClust Gaussian null distribut’n 3rd Key Idea: Factor Analysis Model • Model Covariance as: Biology + Noise Where • is “fairly low dimensional” • is estimated from background noise
SigClust Gaussian null distribut’n Estimation of Background Noise : • Reasonable model (for each gene): Expression = Signal + Noise • “noise” is roughly Gaussian • “noise” terms essentially independent (across genes)
SigClust Gaussian null distribut’n Estimation of Background Noise : Model OK, since data come from light intensities at colored spots
SigClust Gaussian null distribut’n Estimation of Background Noise : • For all expression values (as numbers) • Use robust estimate of scale • Median Absolute Deviation (MAD) (from the median) • Rescale to put on same scale as s. d.:
SigClust Estimation of Background Noise • Overall distribution has strong kurtosis • Shown by height of kde relative to MAD based Gaussian fit • Mean and Median both ~ 0 • SD ~ 1, driven by few large values • MAD ~ 0.7, driven by bulk of data
SigClust Estimation of Background Noise • Central part of distribution “seems to look Gaussian” • But recall density does not provide useful diagnosis of Gaussianity • Better to look at Q-Q plot
SigClust Estimation of Background Noise • Distribution clearly not Gaussian • Except near the middle • Q-Q curve is very linear there (closely follows 45o line) • Suggests Gaussian approx. is good there • And that MAD scale estimate is good (Always a good idea to do such diagnostics)
SigClust Estimation of Background Noise • Checks that estimation of matters • Show sample s.d. is indeed too large • As expected • Variation assessed by Q-Q envelope plot • Shows variation negligible • Not surprising with n ~ 5 million
SigClust Gaussian null distribut’n Estimation of Biological Covariance : • Keep only “large” eigenvalues • Defined as • So for null distribution, use eigenvalues:
SigClustEstimation of Eigenval’s • All eigenvalues > ! • Suggests biology is very strong here! • I.e. very strong signal to noise ratio • Have more structure than can analyze (with only 533 data points) • Data are very far from pure noise • So don’t actually use Factor Anal. Model • Instead end up with estim’d eigenvalues
SigClust Estimation of Eigenval’s • Do we need the factor model? • Explore this with another data set (with fewer genes) • This time: • n = 315 cases • d = 306 genes
SigClust Estimation of Eigenval’s • Try another data set, with fewer genes • This time: • First ~110 eigenvalues > • Rest are negligible • So threshold smaller ones at
SigClust Gaussian null distribution - Simulation Now simulate from null distribution using: where (indep.) Again rotation invariance makes this work (and location invariance)
SigClust Gaussian null distribution - Simulation Then compare data CI, With simulated null population CIs • Spirit similar to DiProPerm • But now significance happens for smaller values of CI
An example (details to follow) P-val = 0.0045
SigClust Modalities Two major applications: • Test significance of given clusterings (e.g. for those found in heat map) (Use given class labels) • Test if known cluster can be further split (Use 2-means class labels)
SigClust Real Data Results Analyze Perou 500 breast cancer data (large cross study combined data set) Current folklore: 5 classes • Luminal A • Luminal B • Normal • Her 2 • Basal
Perou 500 – Fundamental Question Are Luminal A & Luminal B really distinct clusters? Famous for Far Different Survivability
SigClust Results for Luminal A vs. Luminal B P-val = 0.0045
SigClust Results for Luminal A vs. Luminal B Get p-values from: • Empirical Quantile • From simulated sample CIs • Fit Gaussian Quantile • Don’t “believe these” • But useful for comparison • Especially when Empirical Quantile = 0
SigClust Results for Luminal A vs. Luminal B • Test significance of given clusterings • Empirical p-val = 0 • Definitely 2 clusters • Gaussian fit p-val = 0.0045 • same strong evidence • Conclude these really are two clusters
SigClust Results for Luminal A vs. Luminal B • Test if known cluster can be further split • Empirical p-val = 0 • definitely 2 clusters • Gaussian fit p-val = 10-10 • Stronger evidence than above • Such comparison is value of Gaussian fit • Makes sense (since CI is min possible) • Conclude these really are two clusters
SigClust Real Data Results Summary of Perou 500 SigClust Results: • Lum & Norm vs. Her2 & Basal, p-val = 10-19 • Luminal A vs. B, p-val = 0.0045 • Her 2 vs. Basal, p-val = 10-10 • Split Luminal A, p-val = 10-7 • Split Luminal B, p-val = 0.058 • Split Her 2, p-val = 0.10 • Split Basal, p-val = 0.005
SigClust Real Data Results Summary of Perou 500 SigClust Results: • All previous splits were real • Most not able to split further • Exception is Basal, already known • Chuck Perou has good intuition! (insight about signal vs. noise) • How good are others???
SigClust Real Data Results Experience with Other Data Sets: Similar • Smaller data sets: less power • Gene filtering: more power • Lung Cancer: more distinct clusters
SigClust Real Data Results Some Personal Observations • Experienced Analysts Impressively Good • SigClust can save them time • SigClust can help them with skeptics • SigClust essential for non-experts