Structural Insights into bMGL: α/β Hydrolase Fold, Inhibition, and Dynamics
This study presents detailed structural representations of bMGL, an α/β hydrolase, highlighting its minimal fold and canonical structure with key termini. We explore the B-factor values of the Cα atoms across amino acids and identify specific amino acid properties in the substrate binding pocket. Inhibition assays reveal the effect of PMSF concentrations on bMGL activity. Additionally, molecular dynamics simulations illustrate the conformational changes and access path radii post-simulation, alongside a sequence alignment among MGLs from various species, detailing catalytic and structural features.

Structural Insights into bMGL: α/β Hydrolase Fold, Inhibition, and Dynamics
E N D
Presentation Transcript
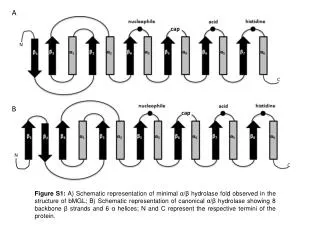
A N cap C B cap N C Figure S1: A) Schematic representation of minimal α/β hydrolase fold observed in the structure of bMGL; B) Schematic representation of canonical α/β hydrolase showing 8 backbone β strands and 6 α helices; N and C represent the respective termini of the protein.
B-factor value (Å2) Residue Figure S2: Graph showing the B-factor values of Cα atom of each amino acid of bMGL; the dotted line indicates the cap region of bMGL (Ile119-Thr164)
Figure S3: Atomic details of the hydrophobic and hydrophilic regions of the substrate binding pocket of bMGL. The hydrophobic residues are coloured brown, hydrophilic pink and the catalytic triad in green.
mmol glycerol/h*mg protein PMSF concentration µM Figure S4: Inhibition of bMGL with increasing concentrations of PMSF. X-axis shows the concentration of PMSF and Y-axis the corresponding specific activity of bMGL.
B A Missing region Figure S5: A) bMGL (violet) covalently bound with PMSF (green). The missing residues in the cap region of the protein are indicated as text. The 2Fo−Fc sigma-weighted electron density map (in purple) is contoured at 1σ around the inhibitor present in the active site. B) Radii profile of the access paths in the bMGL–PMSF complex starting from the active site (Ser97) towards the protein surface.
Figure S6: : Superposition of bMGL (light pink; amino acids Gly135-Glu137 not modelled due to missing electron density) with bMGL (light blue) including the modelled residues in the loop region, shown in cyan; the loop with missing residues is colored magenta
A) bMGL_80 ns MD; closed conformation B) bMGL_80 ns MD; open conformation Figure S7: Radii profile of the access paths of bMGL after 80 ns MD simulation in closed (A) and open (B) conformation starting from the active site (Ser97) toward the protein surface. The product release channel in B is closed and consequently no access path radii are depicted.
Figure S8: Sequence alignment MGLs from various species (human, mouse, yeast, Bacillus sp. H257, Mycobacterium tuberculosis) based on the structural alignment of Fig. 7A . Catalytic residues, oxyanion hole residues, and the GXSXG motifs are colored in red, violet, and green, respectively. The Uniprot accession numbers of the proteins are presented in brackets; identical residues are marked with a asteriks.