Download

1 / 25
250 likes | 364 Vues
This comprehensive study outlines the critical importance of freshwater inflows (FWI) in maintaining the health and productivity of Texas estuaries. It details the methodologies used to assess inflow requirements based on statutory guidelines and biological needs for key species. Key findings highlight how adequate salinity, nutrients, and sediment loading foster a balanced ecological environment essential for fish and shellfish. The report also discusses case studies and the development of optimization models that guide effective water management practices for sustaining estuarine ecosystems.

E N D
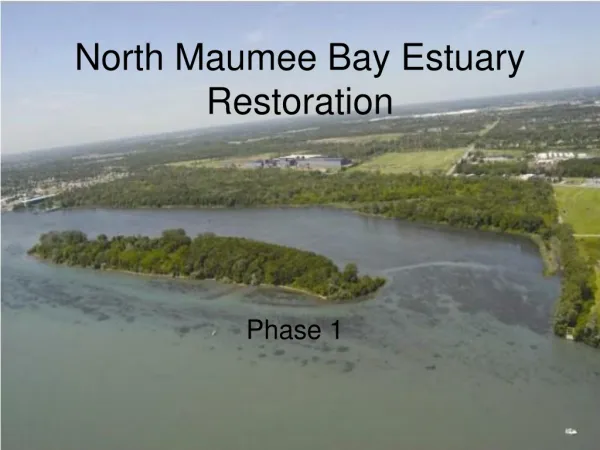
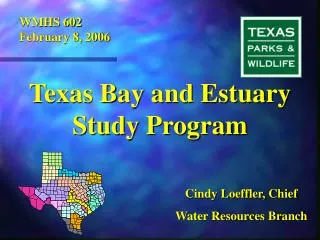
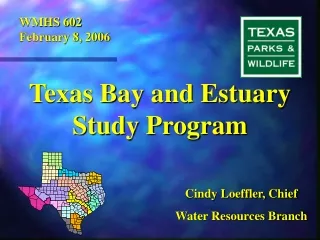
Science Advisory Committee May 21, 2004 Bay and Estuary Studies Methodology Cindy Loeffler
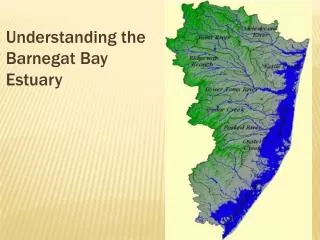
Freshwater Inflows: A Key To Maintaining The Health and Productivity Of Texas Estuaries • Outline: • Statutory Basis • Methodology • Case Study
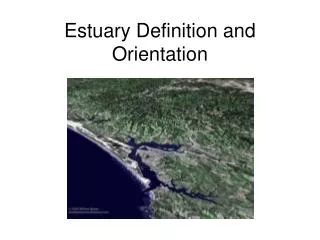
Freshwater Inflows… Gradients Nutrients …By Definition Create and Sustain Estuaries Wetlands
The Fundamental Scientific Basis of the Studies The Fundamental Goal of the Recommendations TWC Section 11.147 Defines Beneficial Inflows As the “Salinity, Nutrient, and Sediment Loading Regime Adequate to Maintain an Ecologically Sound Environment in the Receiving Bay and Estuary System That Is Necessary for the Maintenance and Productivity of Economically Important and Ecologically Characteristic Sport or Commercial Fish and Shellfish Species and Estuarine Life Upon Which Such Fish and Shellfish Are Dependent.”
Objectives & Constraints Verification Nutrient Analysis Hydrology Hydrographic Survey Fisheries Analysis Fisheries Independent Data Sediment Analysis Fisheries Analysis Fisheries Dependent Data TxBLEND Wetlands TxEMP Optimization Model FWI Recommendations Hydrodynamic & Conservation Transport Model The Process of Developing FWI Recommendations
Database: 1962 - 1981 Fisheries Independent Data High Flows Median Flows Low Flows Coastal Fisheries Database – One Of Longest Continuously Collected Databases on Fish Abundance, Distribution And Seasonality. Used To Verify Model Results. Dataset Originally Did Not Include Sufficient Range of Inflows For Model Use Fisheries Dependent Data: An Extensive Database Commonly Used in Fisheries Management With Known and Accepted Limitations: Much of Information Is Self Reported; There Are Gaps (1968); and, Data Is Subject to Catch Per Unit Effort Bias. Database: 1977 - 2004 Two Types of Data Are Used to Develop Inflow Recommendations: Fisheries Dependent and Fisheries Independent:
FWI Recommendations Are Based on the Biological Needs of a Group of Target Species Expressed As A Statistical Relationship Between Harvest And Inflow Target Species: Blue Crab Eastern Oyster Red Drum Black Drum Spotted Sea- Trout Brown Shrimp White Shrimp H = 110.64 – 145.3*ln(Qjf) + 332.5*ln(Qja) – 141.4*ln(Qso) H = 3000.7 + 180.4*ln(Qma) – 963.3*ln(Qmj) + 710*ln(Qja) - 231.5*ln(Qso) H = 32.786 + 0.0797*Qmj + 0.2750*Qja – 0.2010*Qnd H = -18.087 + 0.2411*Qjf – 0.1734*Qma + 0.0850*Qnd ln(H) = 2.6915 – 0.7185*ln(Qma) + 1.86*ln(Qmj) – 1.086*ln(Qnd) ln(H) = 6.5679 + 0.6707*ln(Qja) – 0.7486*ln(Qso) H = 545.59 + 160.9*ln(Qjf) + 279.1*ln(Qmj) – 155.1*ln(Qja) - 277.9*ln(Qnd)
TPWD and TWDB Have Jointly Developed FWI Recommendations To Maintain the Health and Productivity of Texas Estuaries TxEMP Is The Optimization Model That Produces a Range Of Inflows Within Which Estuarine Health and Productivity Needs May be Met
A Range Of Possible Solutions Lies Between Two Points Along An Optimization Curve: MaxH and MinQ MaxH is FWI Necessary To Sustain Historic Fisheries Harvest as Evaluated Against Existing Fisheries Data To Meet The Legislative Definition Of Beneficial Inflows MinQ Is the Minimum Inflow That Maintains 80% Of Mean Historic Harvest and All Other Physical Constraints: Salinity, Nutrient, and Sediment Needs
Delivery of Freshwater Inflows Must Incorporate Seasonality to Have Any Ecological Significance FWI Seasonal Distribution San Antonio Bay The Recommended FWI Is Often Expressed As a Single Annualized Number, But Always Infers The Sum of Bi-Monthly Inflows
Identify and Assemble Datasets Representative of Estuarine Ecosystem Identify and Assemble Datasets That Reflect Changes in Inflows FWI Recommendations Summary: Methodology to Determine the Freshwater Inflows Necessary to Meet the Legislative Directive of TWC Section 11.147 Overlay Real Data Onto Model And Adjust To Allow Projections Of FWI’s Create a Model That Integrates Datasets and Responds Realistically To Varying Freshwater Inflows
Methods for Determining Minimum Freshwater Inflow Needs of Texas Bays and Estuaries - Powell, Matsmuto, Brock. In Estuaries December 2002. “Nowhere in the World Has the Issue of Freshwater Inflow Been Studied So Systematically, or The Results Used to Guide Water Management Policies and Practices So Effectively, Than in the State of Texas.” – A Review and Application of Literature Concerning Freshwater Flow Management in Riverine Estuaries (2000), by Dr. E. Estevez, Director, Center for Coastal and Tropical Ecology, Mote Marine Laboratory, Sarasota, Florida.
Sabine 9.5* Galveston 5.2 Matagorda 2.0 San Antonio 1.15 Aransas 0.82 Nueces 0.14 Laguna Madre 0.25 TPWD/TWDB/TCEQ: “Studies Represent A Benchmark…” Legislatively Mandated Studies to Determine Freshwater Inflows Necessary to Conserve Health and Productivity Of Texas Major Estuaries Have Been Completed * Millions of Acre Feet Per Year
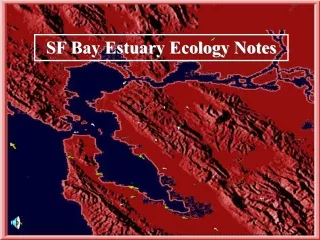
Case Study Galveston Bay
TXBLEND Output • Monthly Salinity Maps Under Each TxEMP Solution • Salinity Difference Maps • Spatial Relationships of Modeled Salinity Zones to Critical Habitat Areas
White Shrimp Abundance in Galveston Bay • Higher abundance correlates with lower salinity levels
Galveston Bay TXBLEND Time Series • Daily salinity at a point in Upper Galveston Bay • Predicted salinity within upper and lower limits for MaxH and MinQ
TxEMP MinQ and MaxH Solutions TPWD Recommendation
TCEQ Comparison of Naturalized, Unappropriated and Environmental Flows DRAFT ~15% reduction Target flows met ~ 20% Target flows met 50% Target flows met 95% Target flows met ~35% ~75% reduction
Ongoing State Studies Galveston Bay Update 8/31/2005 Christmas Bay 8/31/2007 Brazos Estuary 8/31/2006 San Benard and Cedar Lakes 8/31/2008 East Matagorda Bay 8/31/2004 Matagorda Bay Update 12/31/2004 Minor Bay Studies and Major Bay Updates Rio Grande and South Bay 12/31/2005
Independent Studies Galveston Bay Freshwater Inflow Needs Study Review LCRA-SAWS Bay Health Lower Guadalupe Basin Water Supply Project