Have you seen this image?
Have you seen this image?. What does it represent ?. Leonardo da Vinci’s drawing , Vitruvian Man shows how the proportions of the human body fit perfectly into a circle or a square. This diagram by Leonardo da Vinci is an illustration of Vitruvius ’ theory. .

Have you seen this image?
E N D
Presentation Transcript
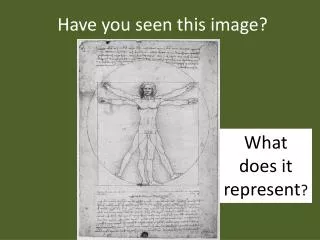
Have you seen this image? What does it represent?
Leonardo da Vinci’s drawing , Vitruvian Man shows how the proportions of the human body fit perfectly into a circle or a square. This diagram by Leonardo da Vinci is an illustration of Vitruvius’ theory.
According to Vitruvius’ theory the distance from fingertip to fingertip (arm span) should be equal to the distance from head to heel (height).
In this activity you will explorethe legitimacy of Vitruvius’ claim on the relationship between arm span and height.
1. Discuss Vitruvius’ claims with your lab partner.2. Write your hypothesis concerning Arm Span and height.3. Use the provided materials to record each of your own measurements as data.4. Class Data will be pooled and analyzed on Friday.
CONCLUSION QUESTIONS1. Does your individual data for height and arm span support Vitruvius’ theory? Why or why not?2. How do your height and arm span results compare to other groups in the class? Explain.3. Does the class height and arm span data support Vitruvius’ theory? Why or why not?4. When comparing males and females, does one group fit Vitruvius’ theory more closely than the other? Explain your answer.
5. Why was it necessary to collect data from other students in the class?6. Describe 3 scientific processes/methods you learned from this activity that are important when collecting and reporting data.
IMPORTANT ----Data Collection/Reporting • Maintain SI units • Use standardized method /procedure for all trials • Use multiple trials • Use large sample size • Use measuring tool with smallest increments